Sneak Peek: Inside StringTheory Beta
A light introduction to Knowledge Graphs and walkthrough of the beta launch

This weekend, I’ll be dropping the public beta link for StringTheory. Anyone will be able to sign up, access the platform, and start exploring.
But before I hand over the keys, I want to give you a preview of the platform, the current user experience, and the kind of research you can do on day one.
The Invisible Engine: Why a Graph?
In my first post, I mentioned StringTheory is built like a digital corkboard. That wasn’t just a metaphor for the UI—it’s a literal description of the underlying architecture.
StringTheory is powered by a Knowledge Graph, specifically built on Spanner Graph. I chose this architecture because it gives us a unique superpower: it combines the rock-solid reliability and massive scalability of a world-class relational database (Spanner DB) with the native ability to map and traverse complex networks. I also have never used Google Cloud Platform before, and I am using this project to learn GCP, so that made this an easy choice.
Most political tracking sites rely entirely on traditional databases, where data lives in rigid, isolated tables (e.g., a table for Politicians, a table for Bills). That structure is great for simple questions like, “List all the Senators from Ohio.”, where you are doing simple CRUD operations on a relational database through an API. But we want to ask complex investigative questions: “Show me every politician who co-sponsored these three specific defense bills, and then crossed the aisle to vote against their own party on this related amendment.” In a purely traditional database, querying those multi-layered connections requires massive, clunky equations that effectively hit a wall. But by leveraging Spanner Graph, our data acts as a continuous network. Everything is a Node (a politician, a bill) permanently wired together by Edges (voted for, sponsored by). We aren’t just cross-referencing tables; we are telling the engine to walk the relationships.
Structuring the underlying data as a Graph from day one unlocks the long-term value of StringTheory:
Complex Investigations: Natively trace influence and voting blocs through multiple degrees of separation (”multi-hop” reasoning) in milliseconds.
Predictive Analytics: Train Graph Neural Networks (GNNs) on the “shape” of a politician’s network to predict how they will vote or detect hidden coalitions before they go public.
Deep Research AI: Instead of an LLM hallucinating a narrative based on op-eds, we can ground generative AI directly in our graph. It won’t guess; it will explore the connections intuitively and be able to reason in more complex ways and hand you the receipts.
For this initial Beta, we are laying down this foundation. Before we can track the money or build advanced analytics, we need to map the actual actions. So, V0 of StringTheory is purely the legislative engine.
Here is a walkthrough of the initial platform and how you can use this tool to answer some questions today.
1. Politicians
Most investigations center around our elected officials and their actions. The main power we have as citizens is to analyze our representatives’ actions and hold them to account when actions don’t align with promises or with the priorities of their constituents.
The first step is figuring out who your representatives are or discovering persons of interest you want to explore.
The Politicians page provides a list view to be able to search and sort through current and historical members of Congress, Presidents and Vice Presidents.
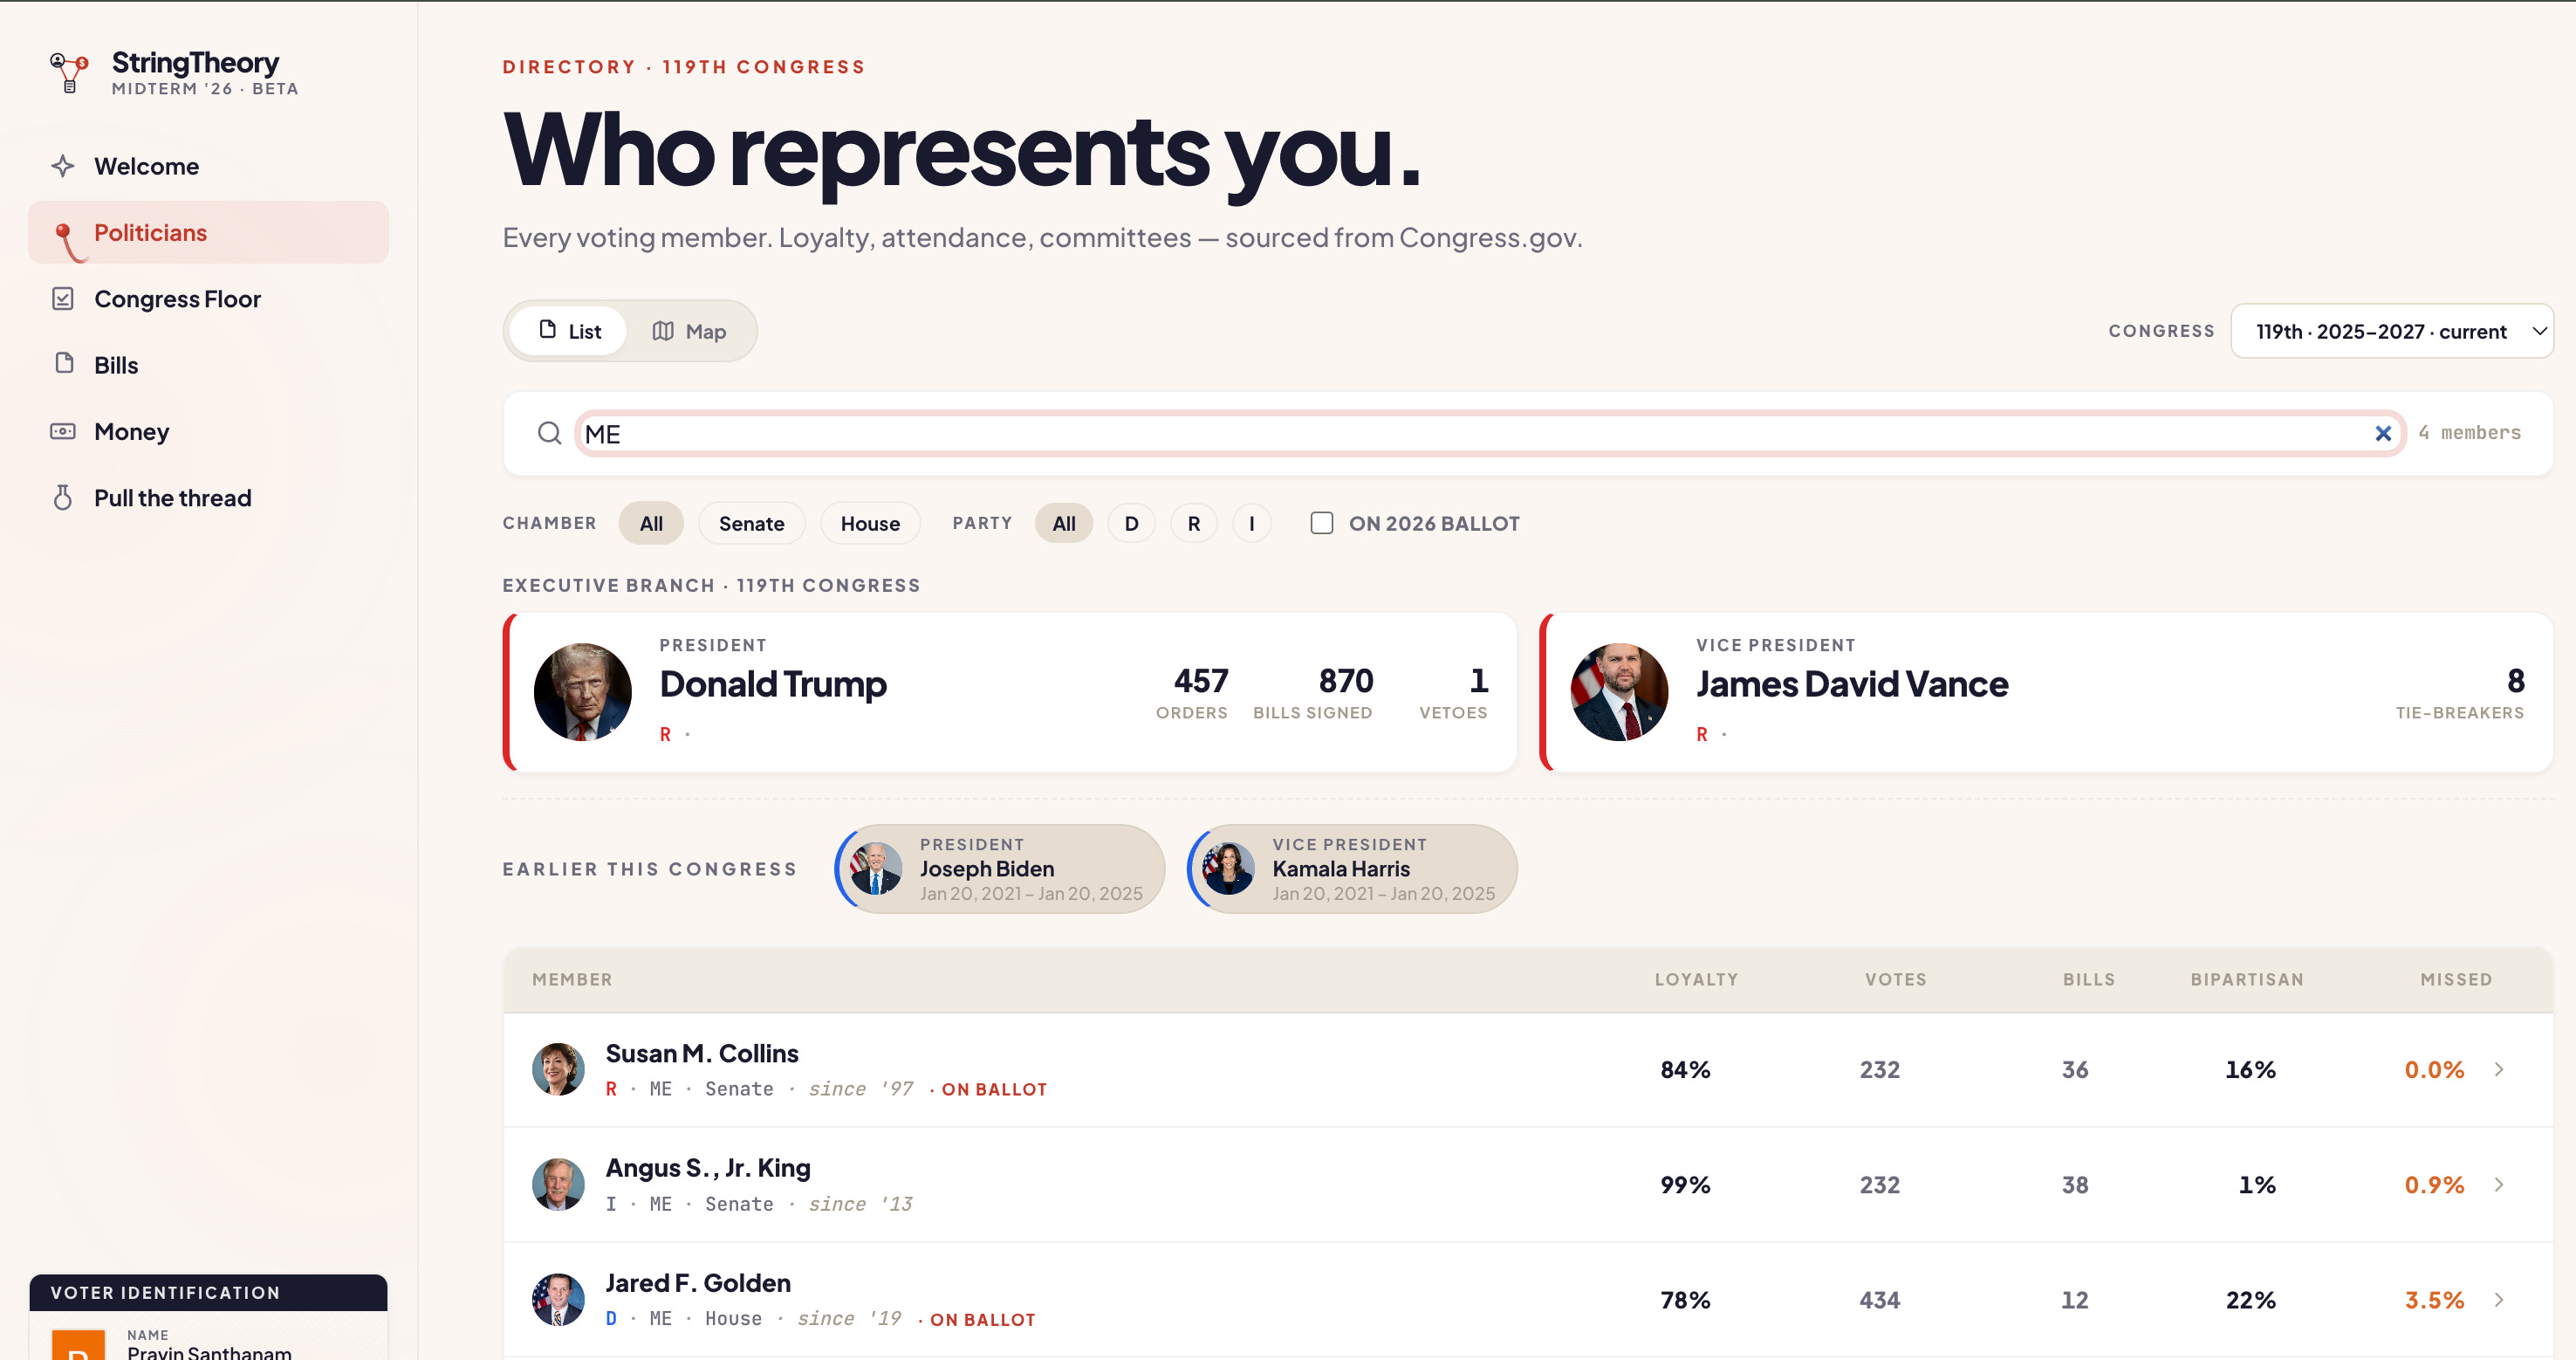
In List View, you can sort on party loyalty, bipartisan sponsorship rates, bills introduced. There are easy filters for chamber, party and even who is on the upcoming ballots for the Mid-terms.
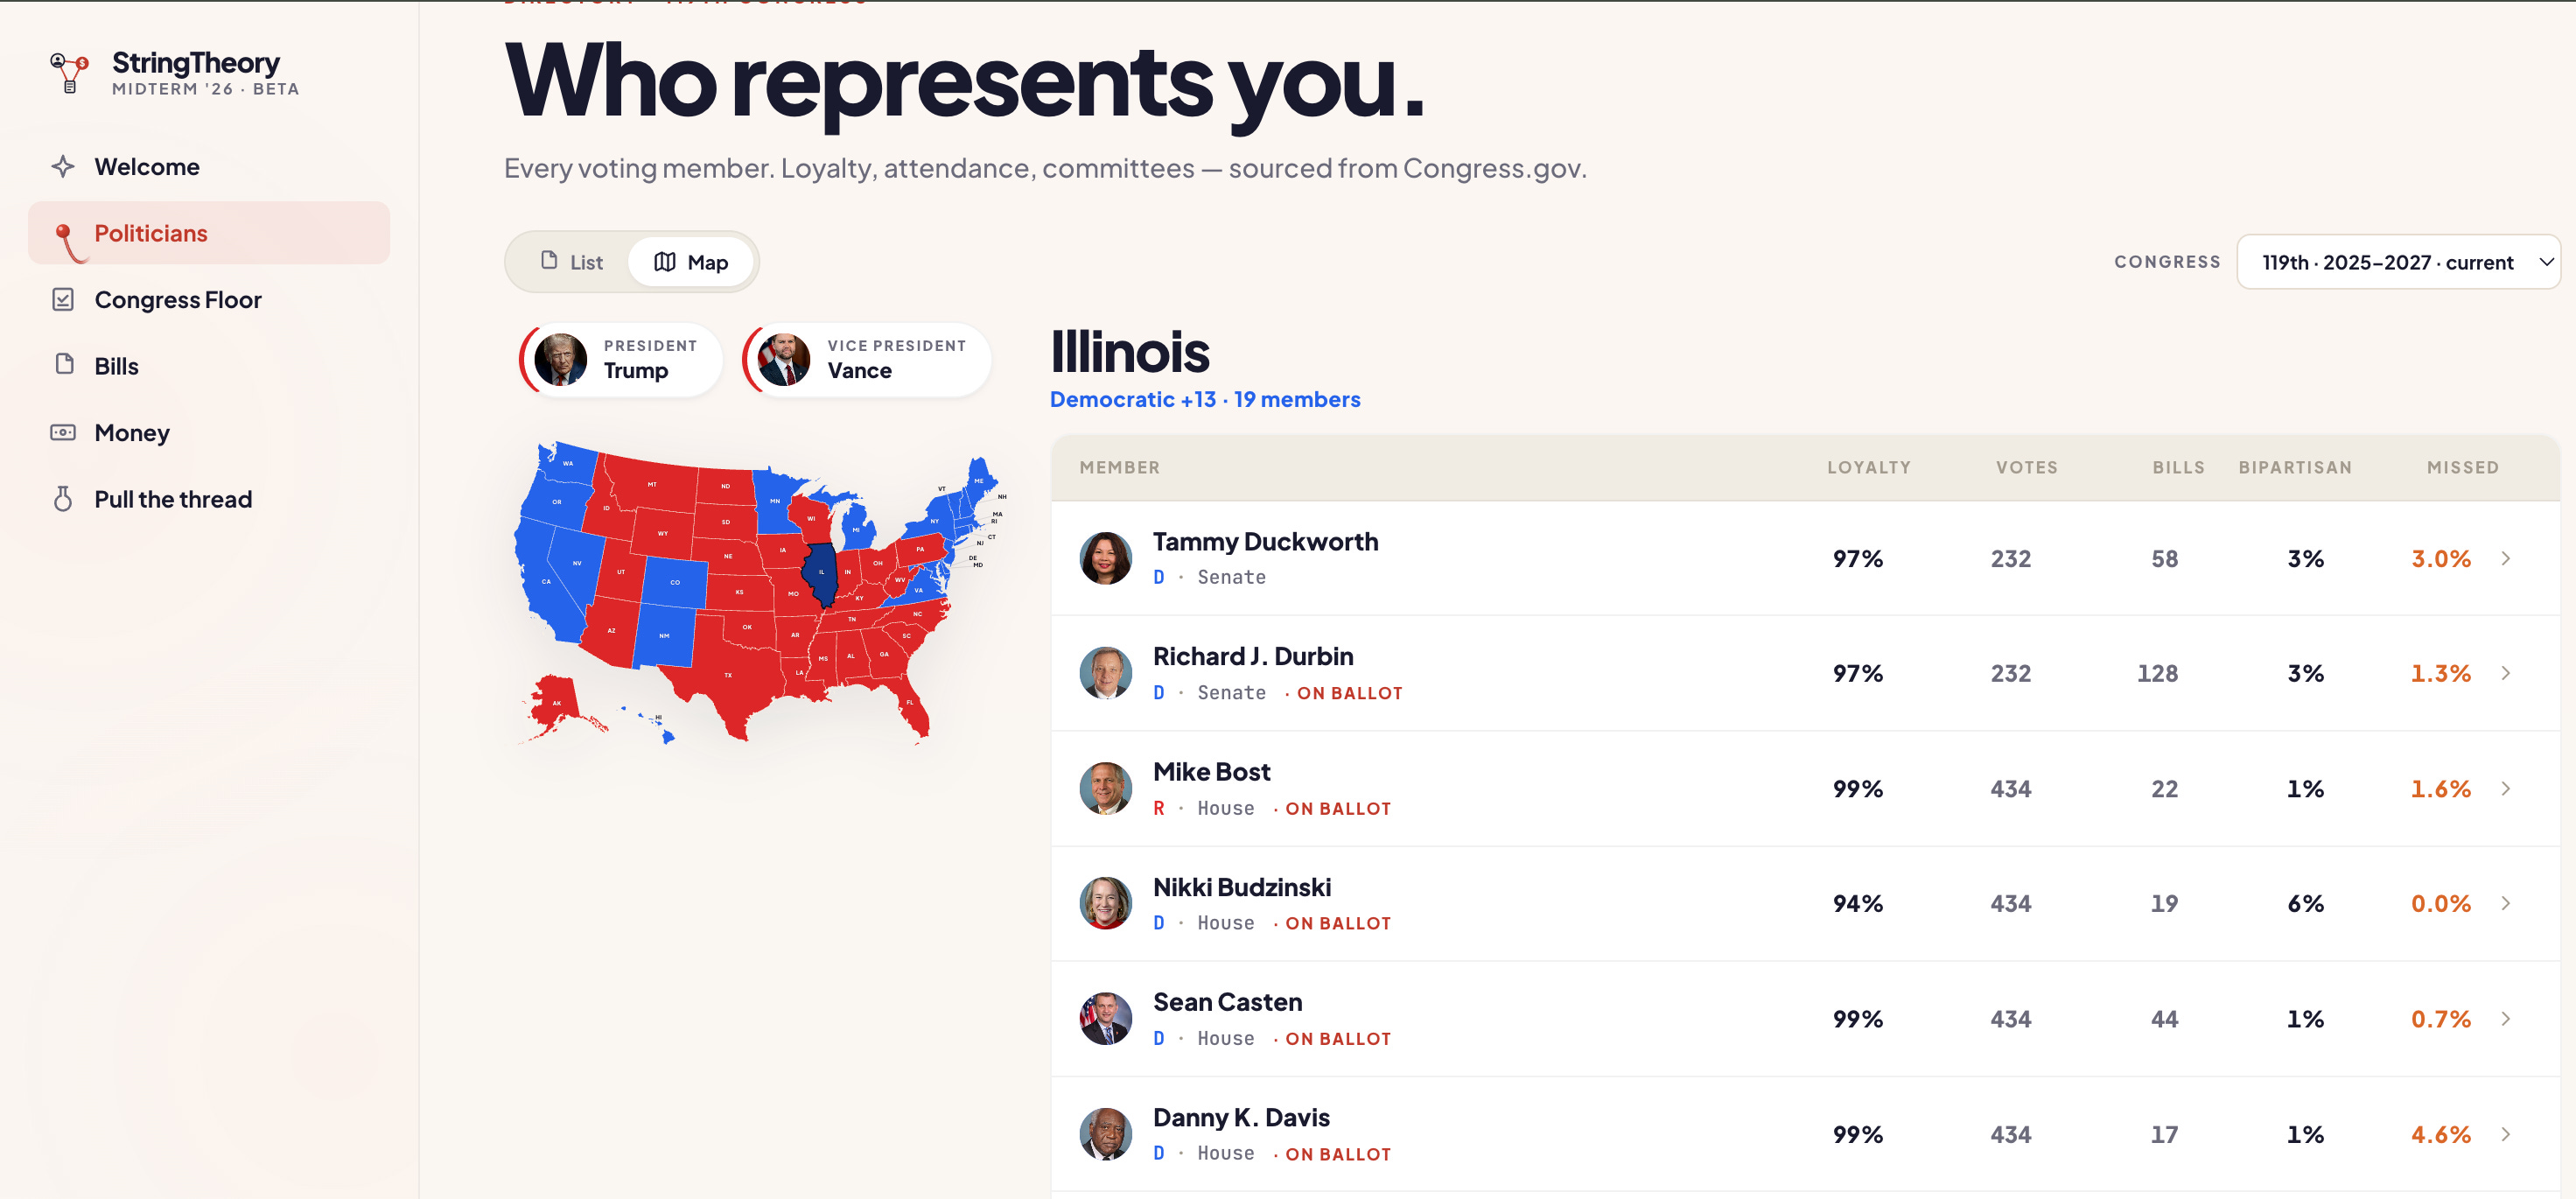
If you don’t know who you are looking for, Map View can help you identify persons of interest by state.
Once you have found your legislator, you can click on their profile page, which gives you the immediate legislative footprint of a single elected official.
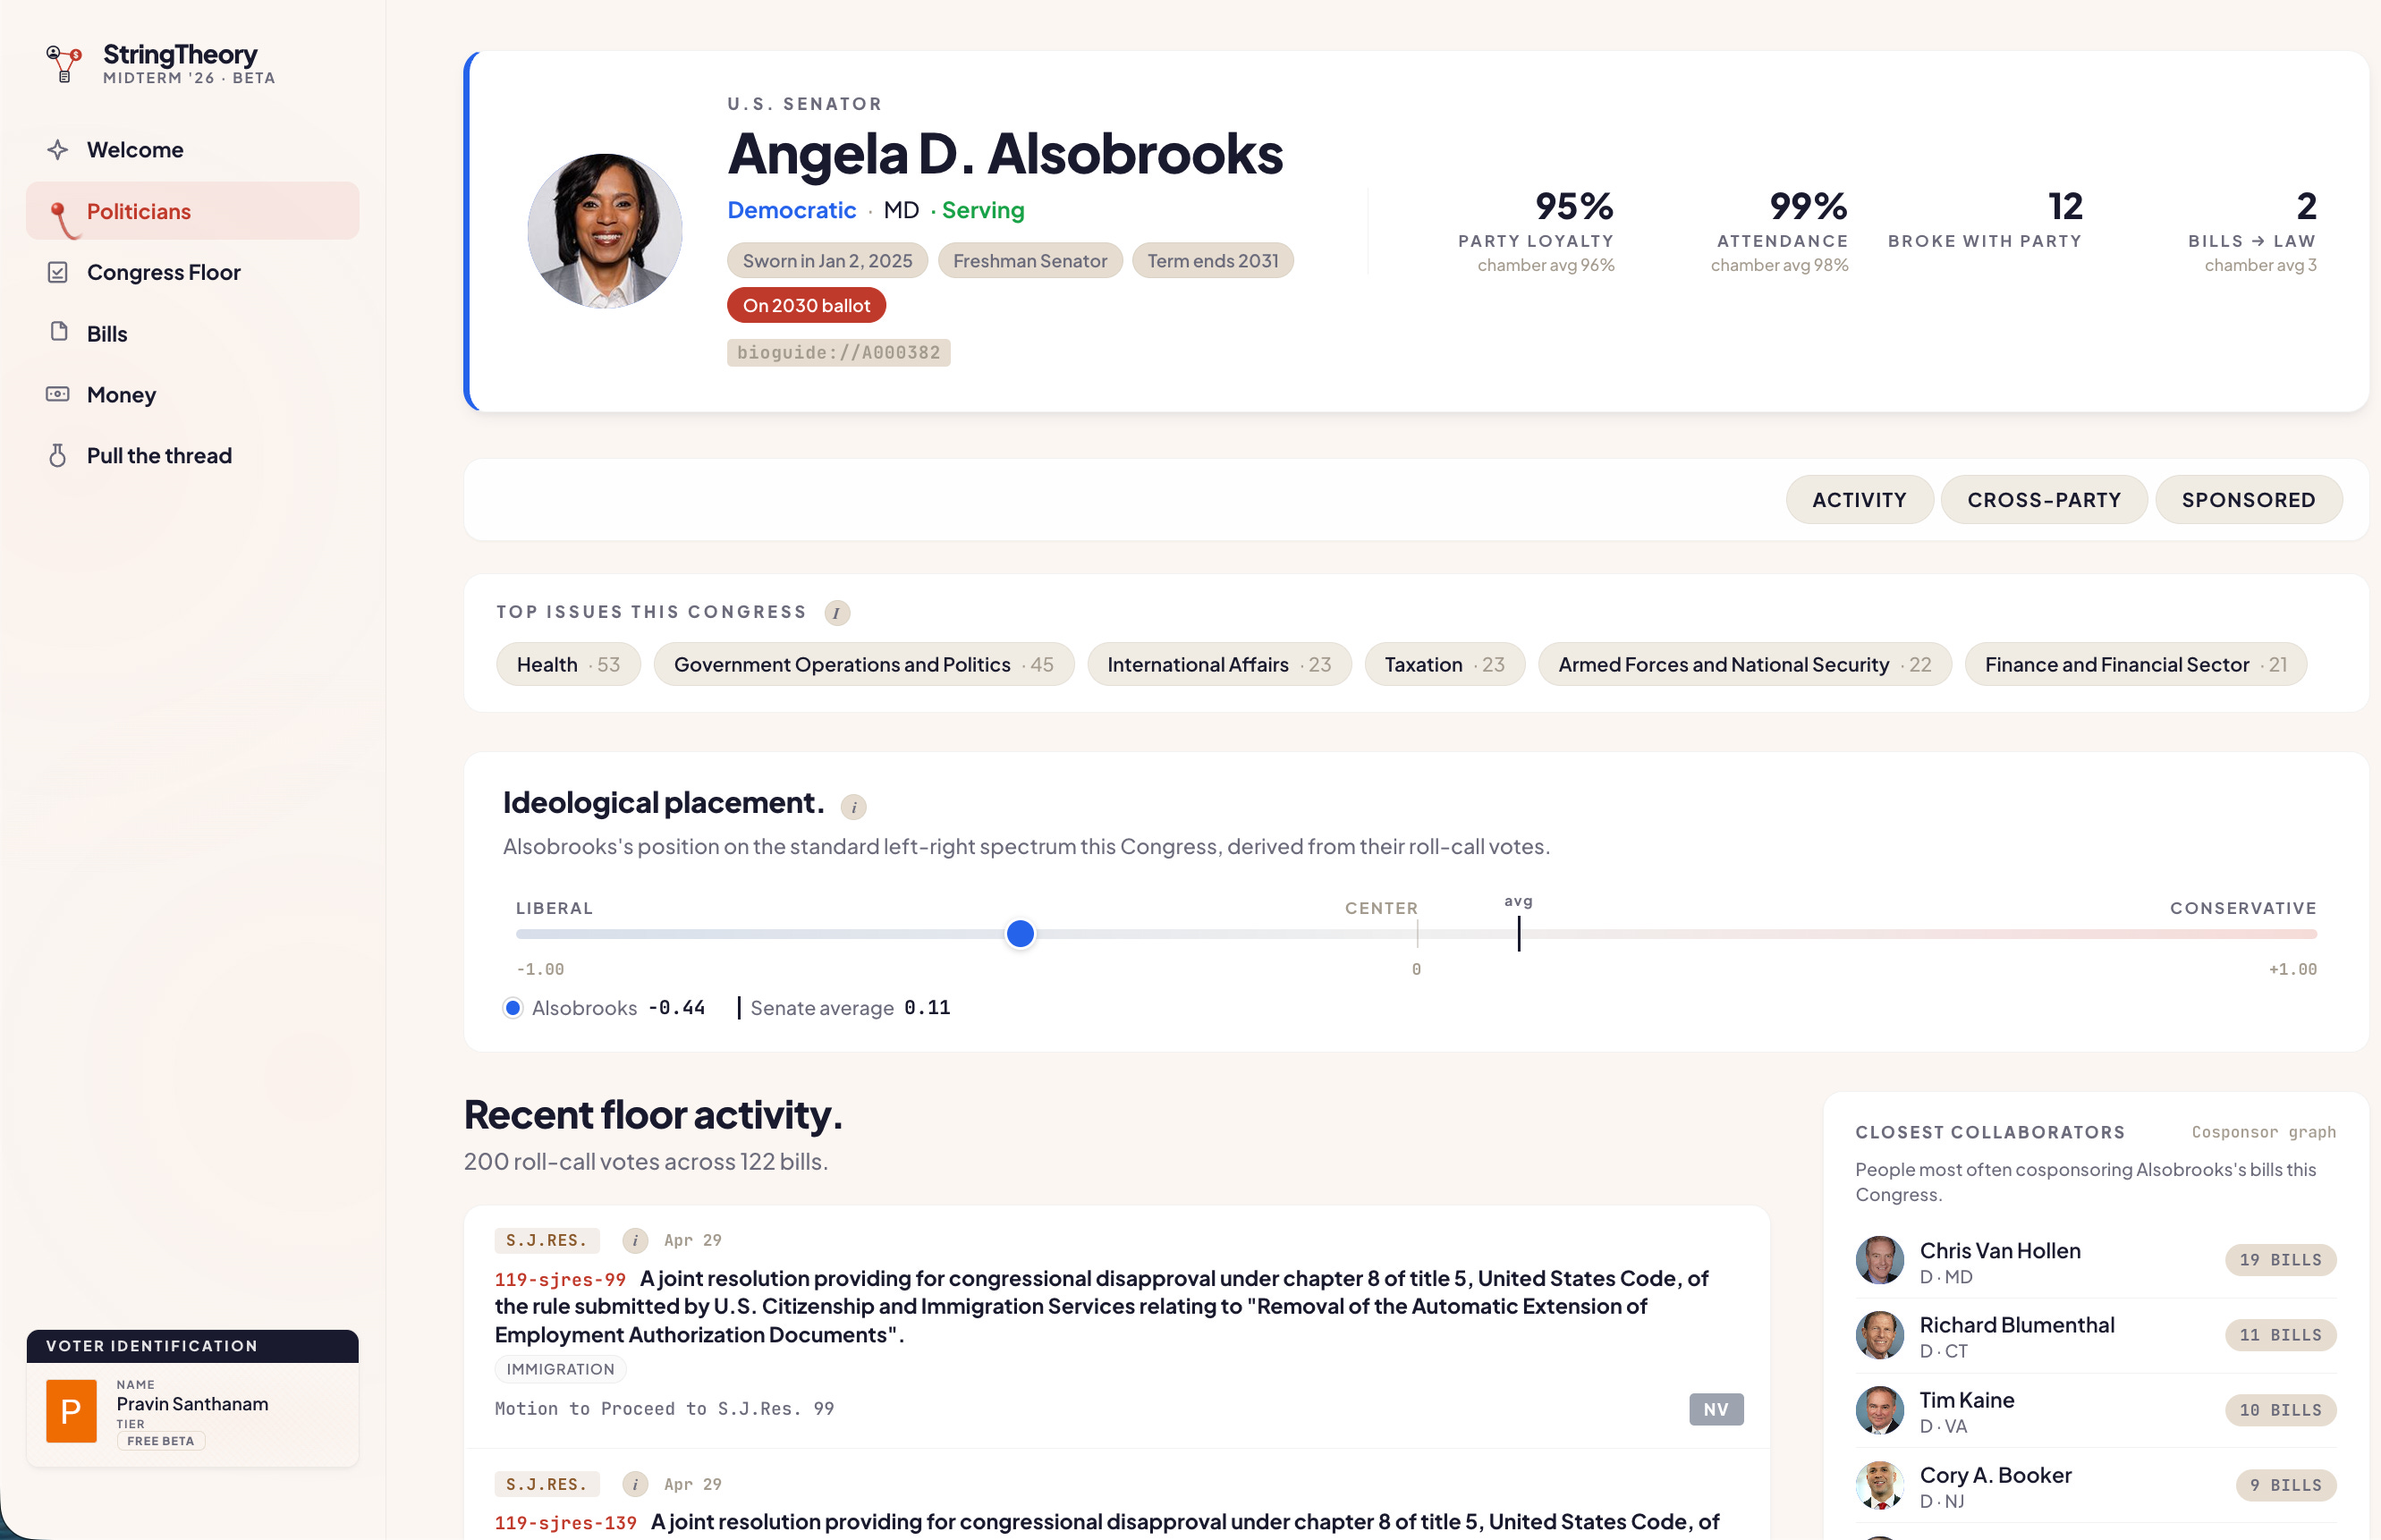
You aren’t just reading a curated biography. You can instantly see their objective ideological placement based purely on their roll-call votes, their recent floor activity, and their closest legislative collaborators. It strips away the campaign rhetoric and focuses entirely on their measurable track record in the chamber.
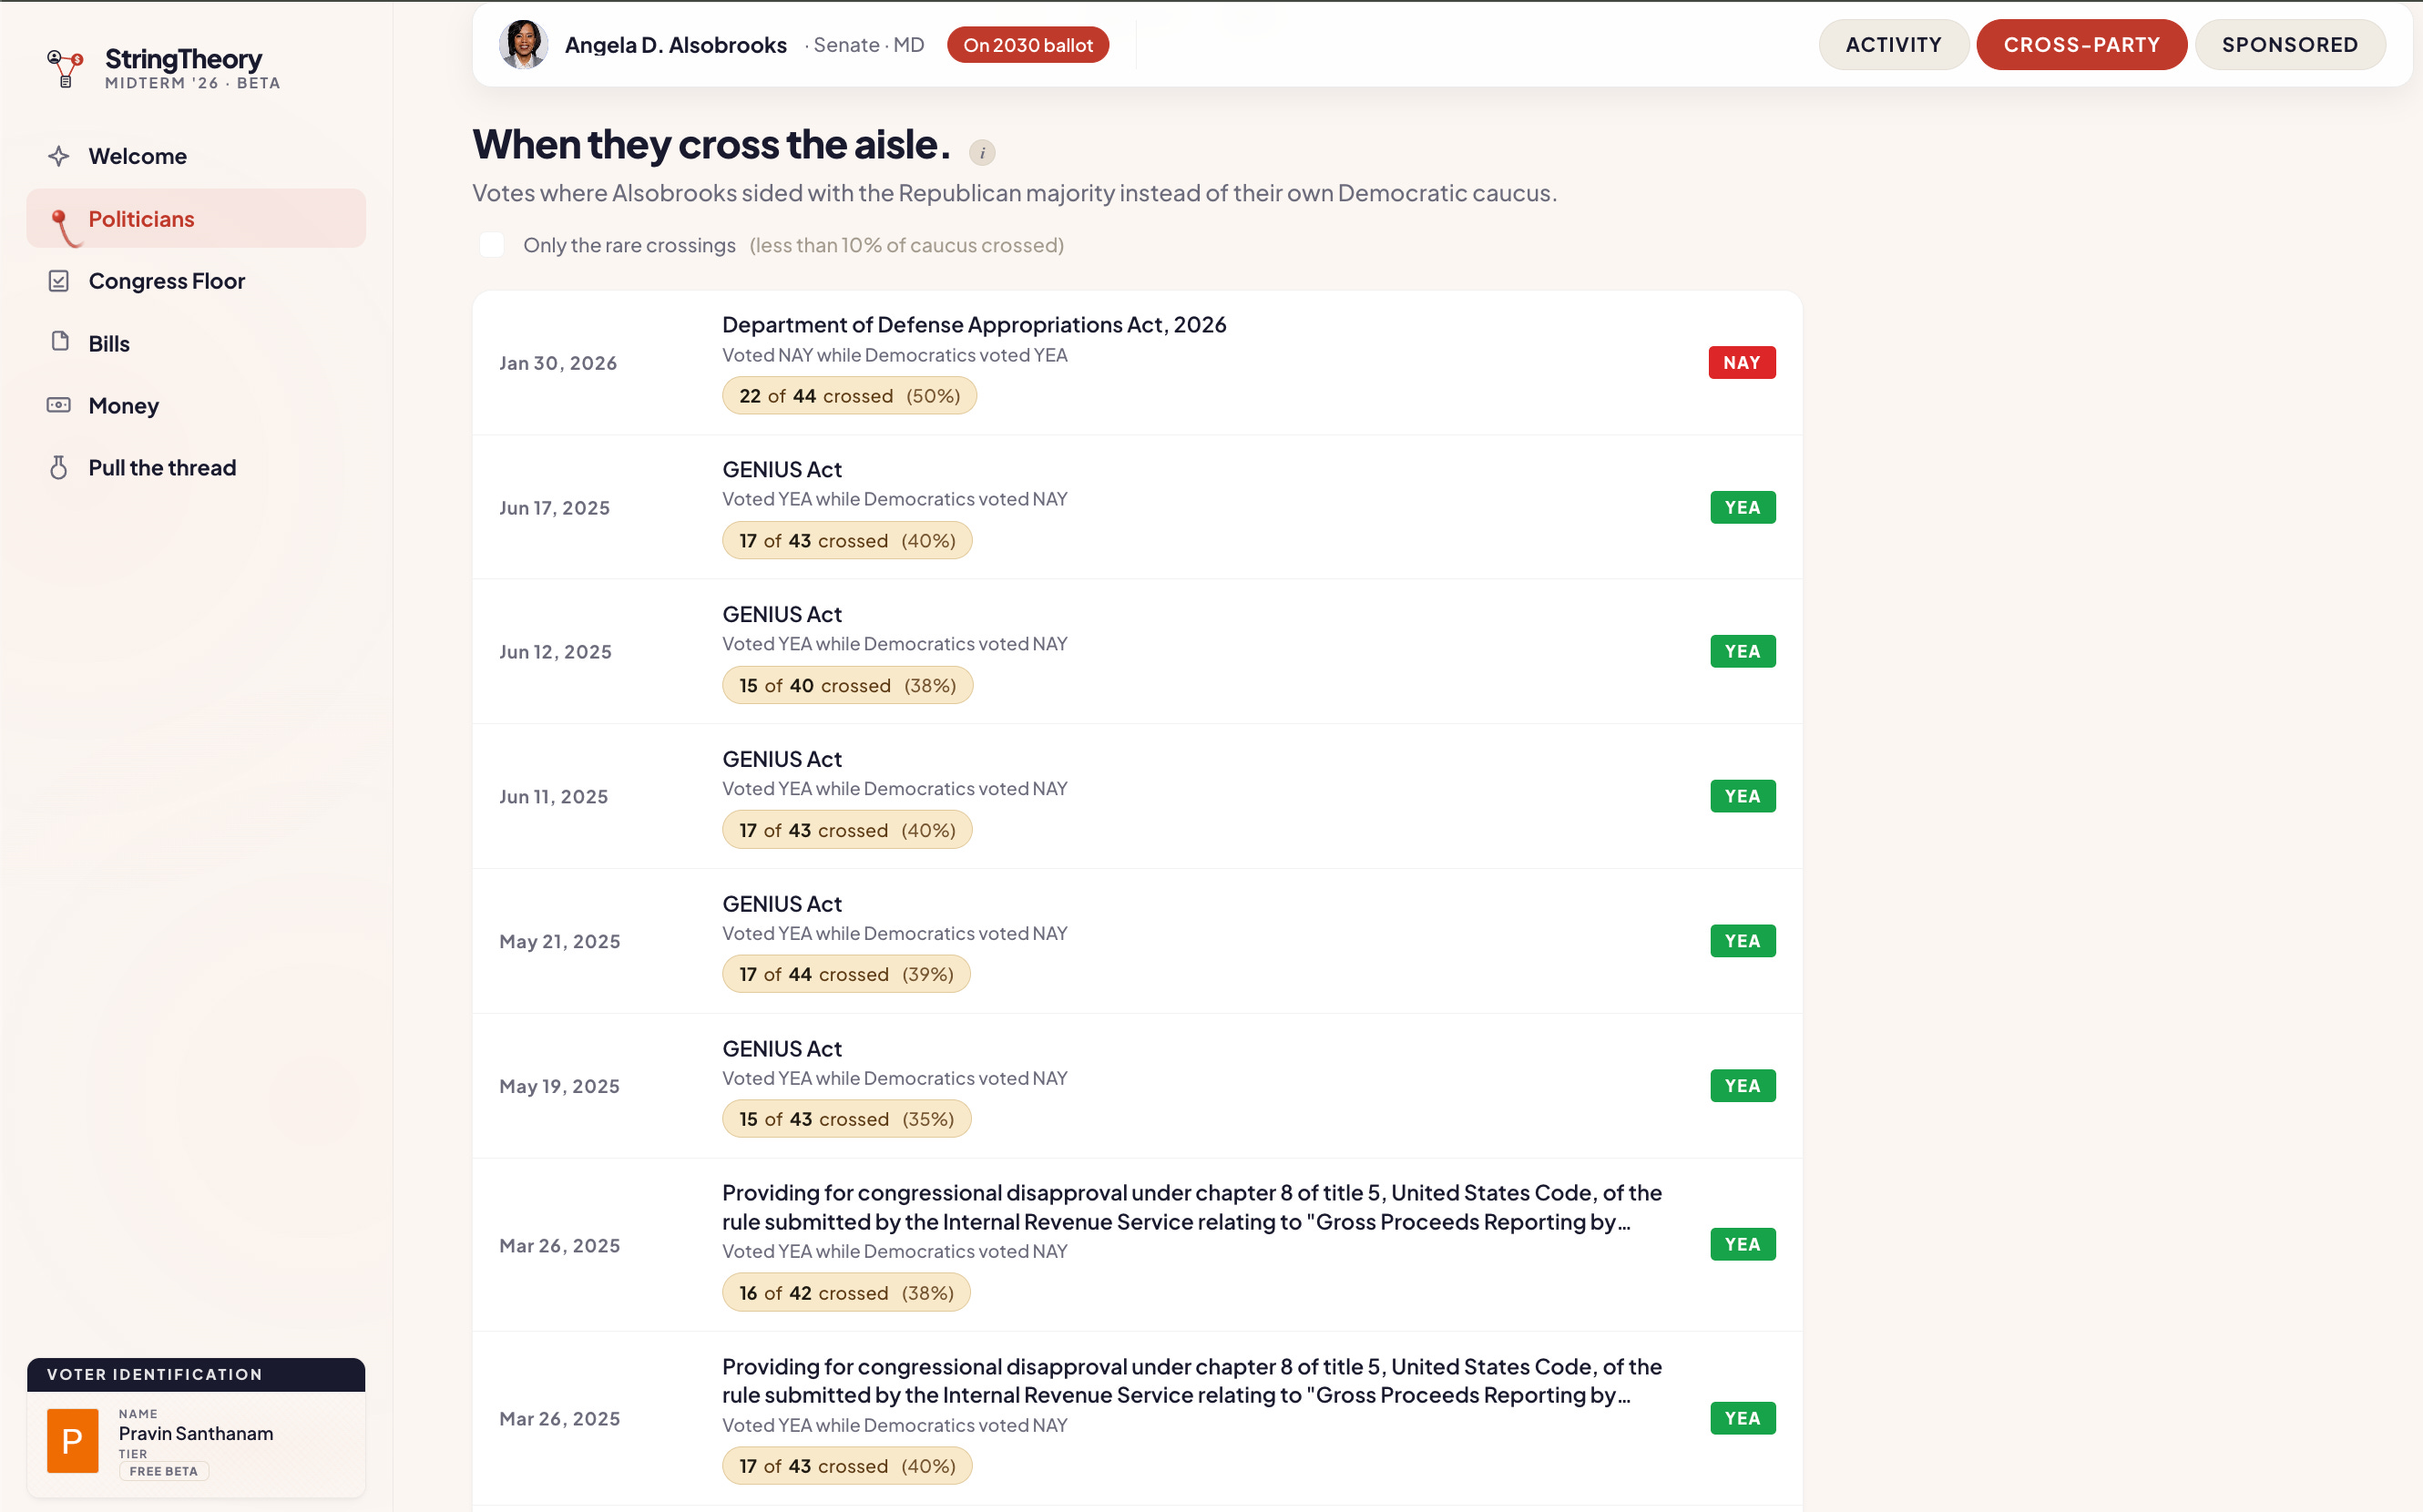
In modern politics, the most telling votes are the ones that break ranks, because in a polarized environment most votes are along party lines. Instead of guessing who the swing votes are, StringTheory isolates and highlights when a politician voted with the opposing majority instead of their own caucus. Republicans currently have more Congress members than the Democrats, so for contested votes to pass, you need defectors, and those are often the interesting policy propositions.
2. Congress Floor
Speaking of voting, the Congress Floor is where the action happens.
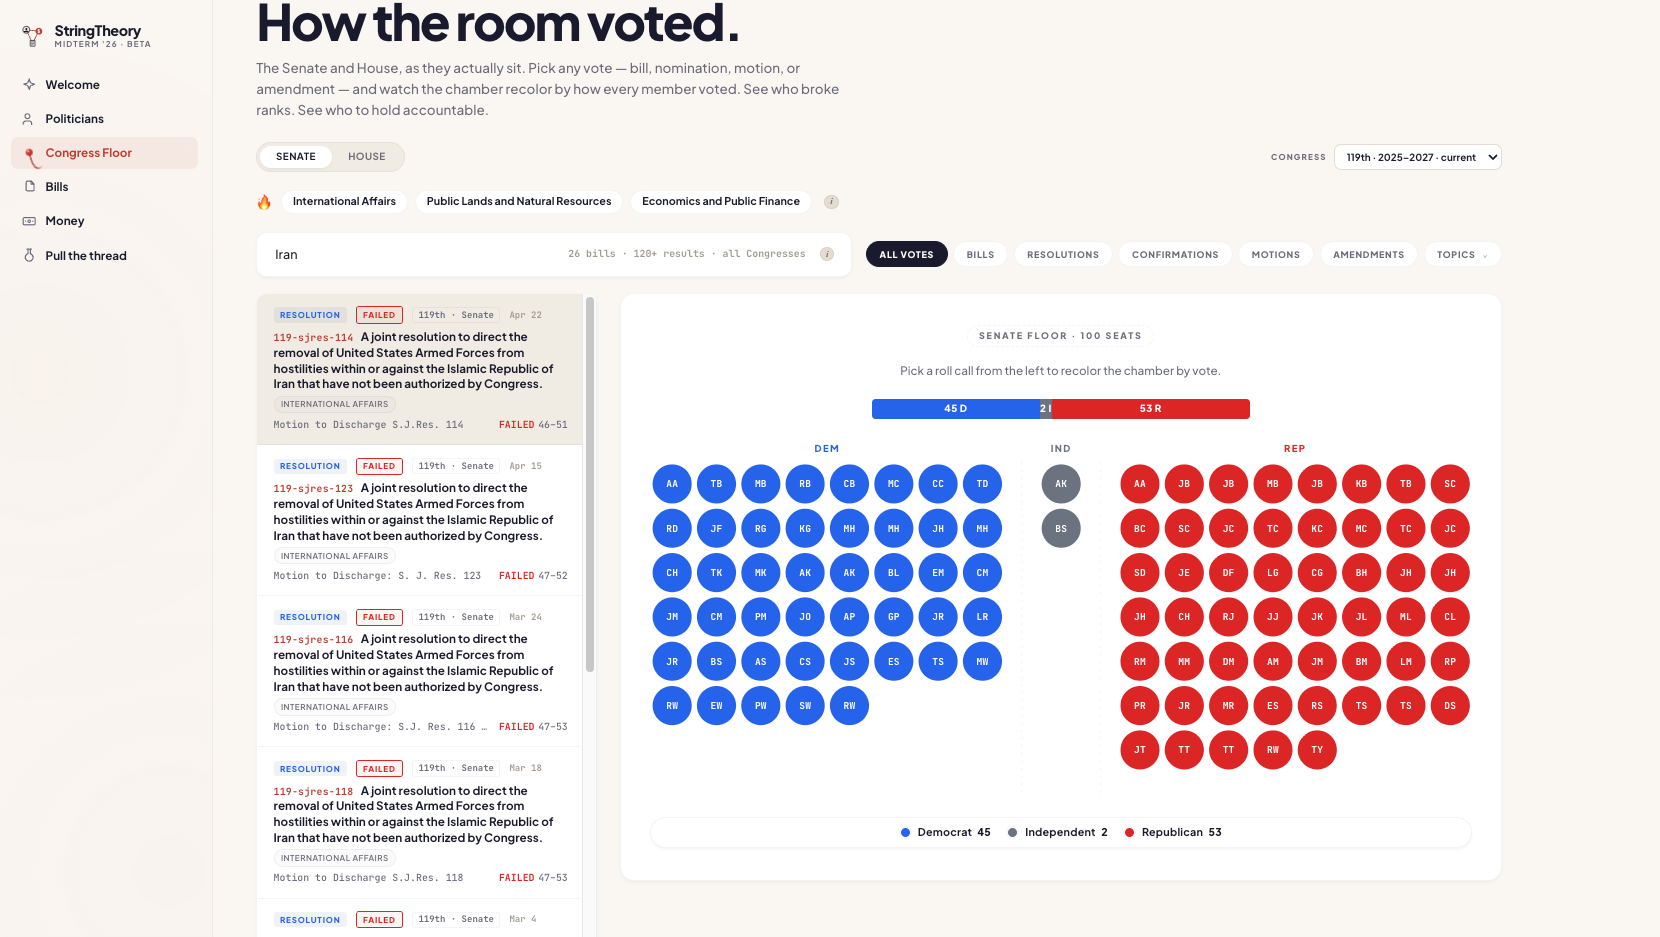
We mapped the Senate and House as they actually sit. If you go back to previous congresses, you can see how party control in congress has fluctuated under different administrations. You can also pick any bill, resolution, or nomination, and watch the chamber color-code exactly how the room voted. It turns a boring roll-call list into an immediate, visual heatmap, which will be highly sharable for receipts in content and research.
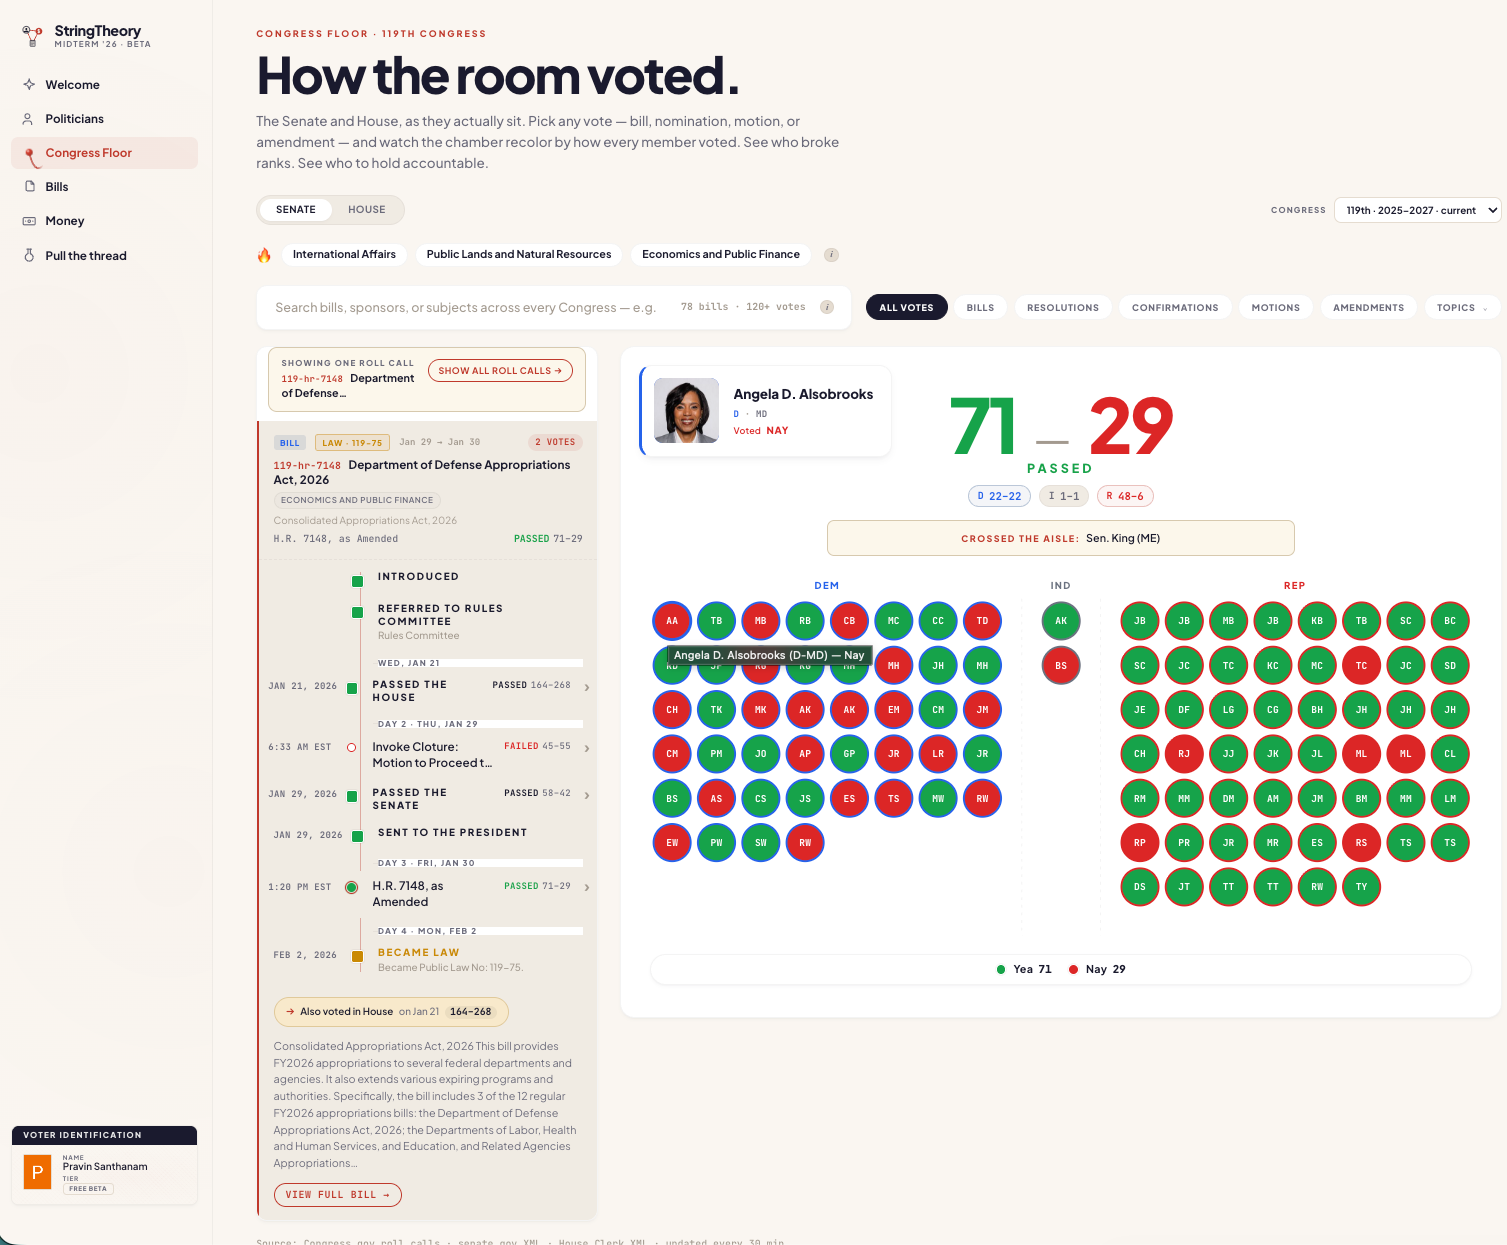
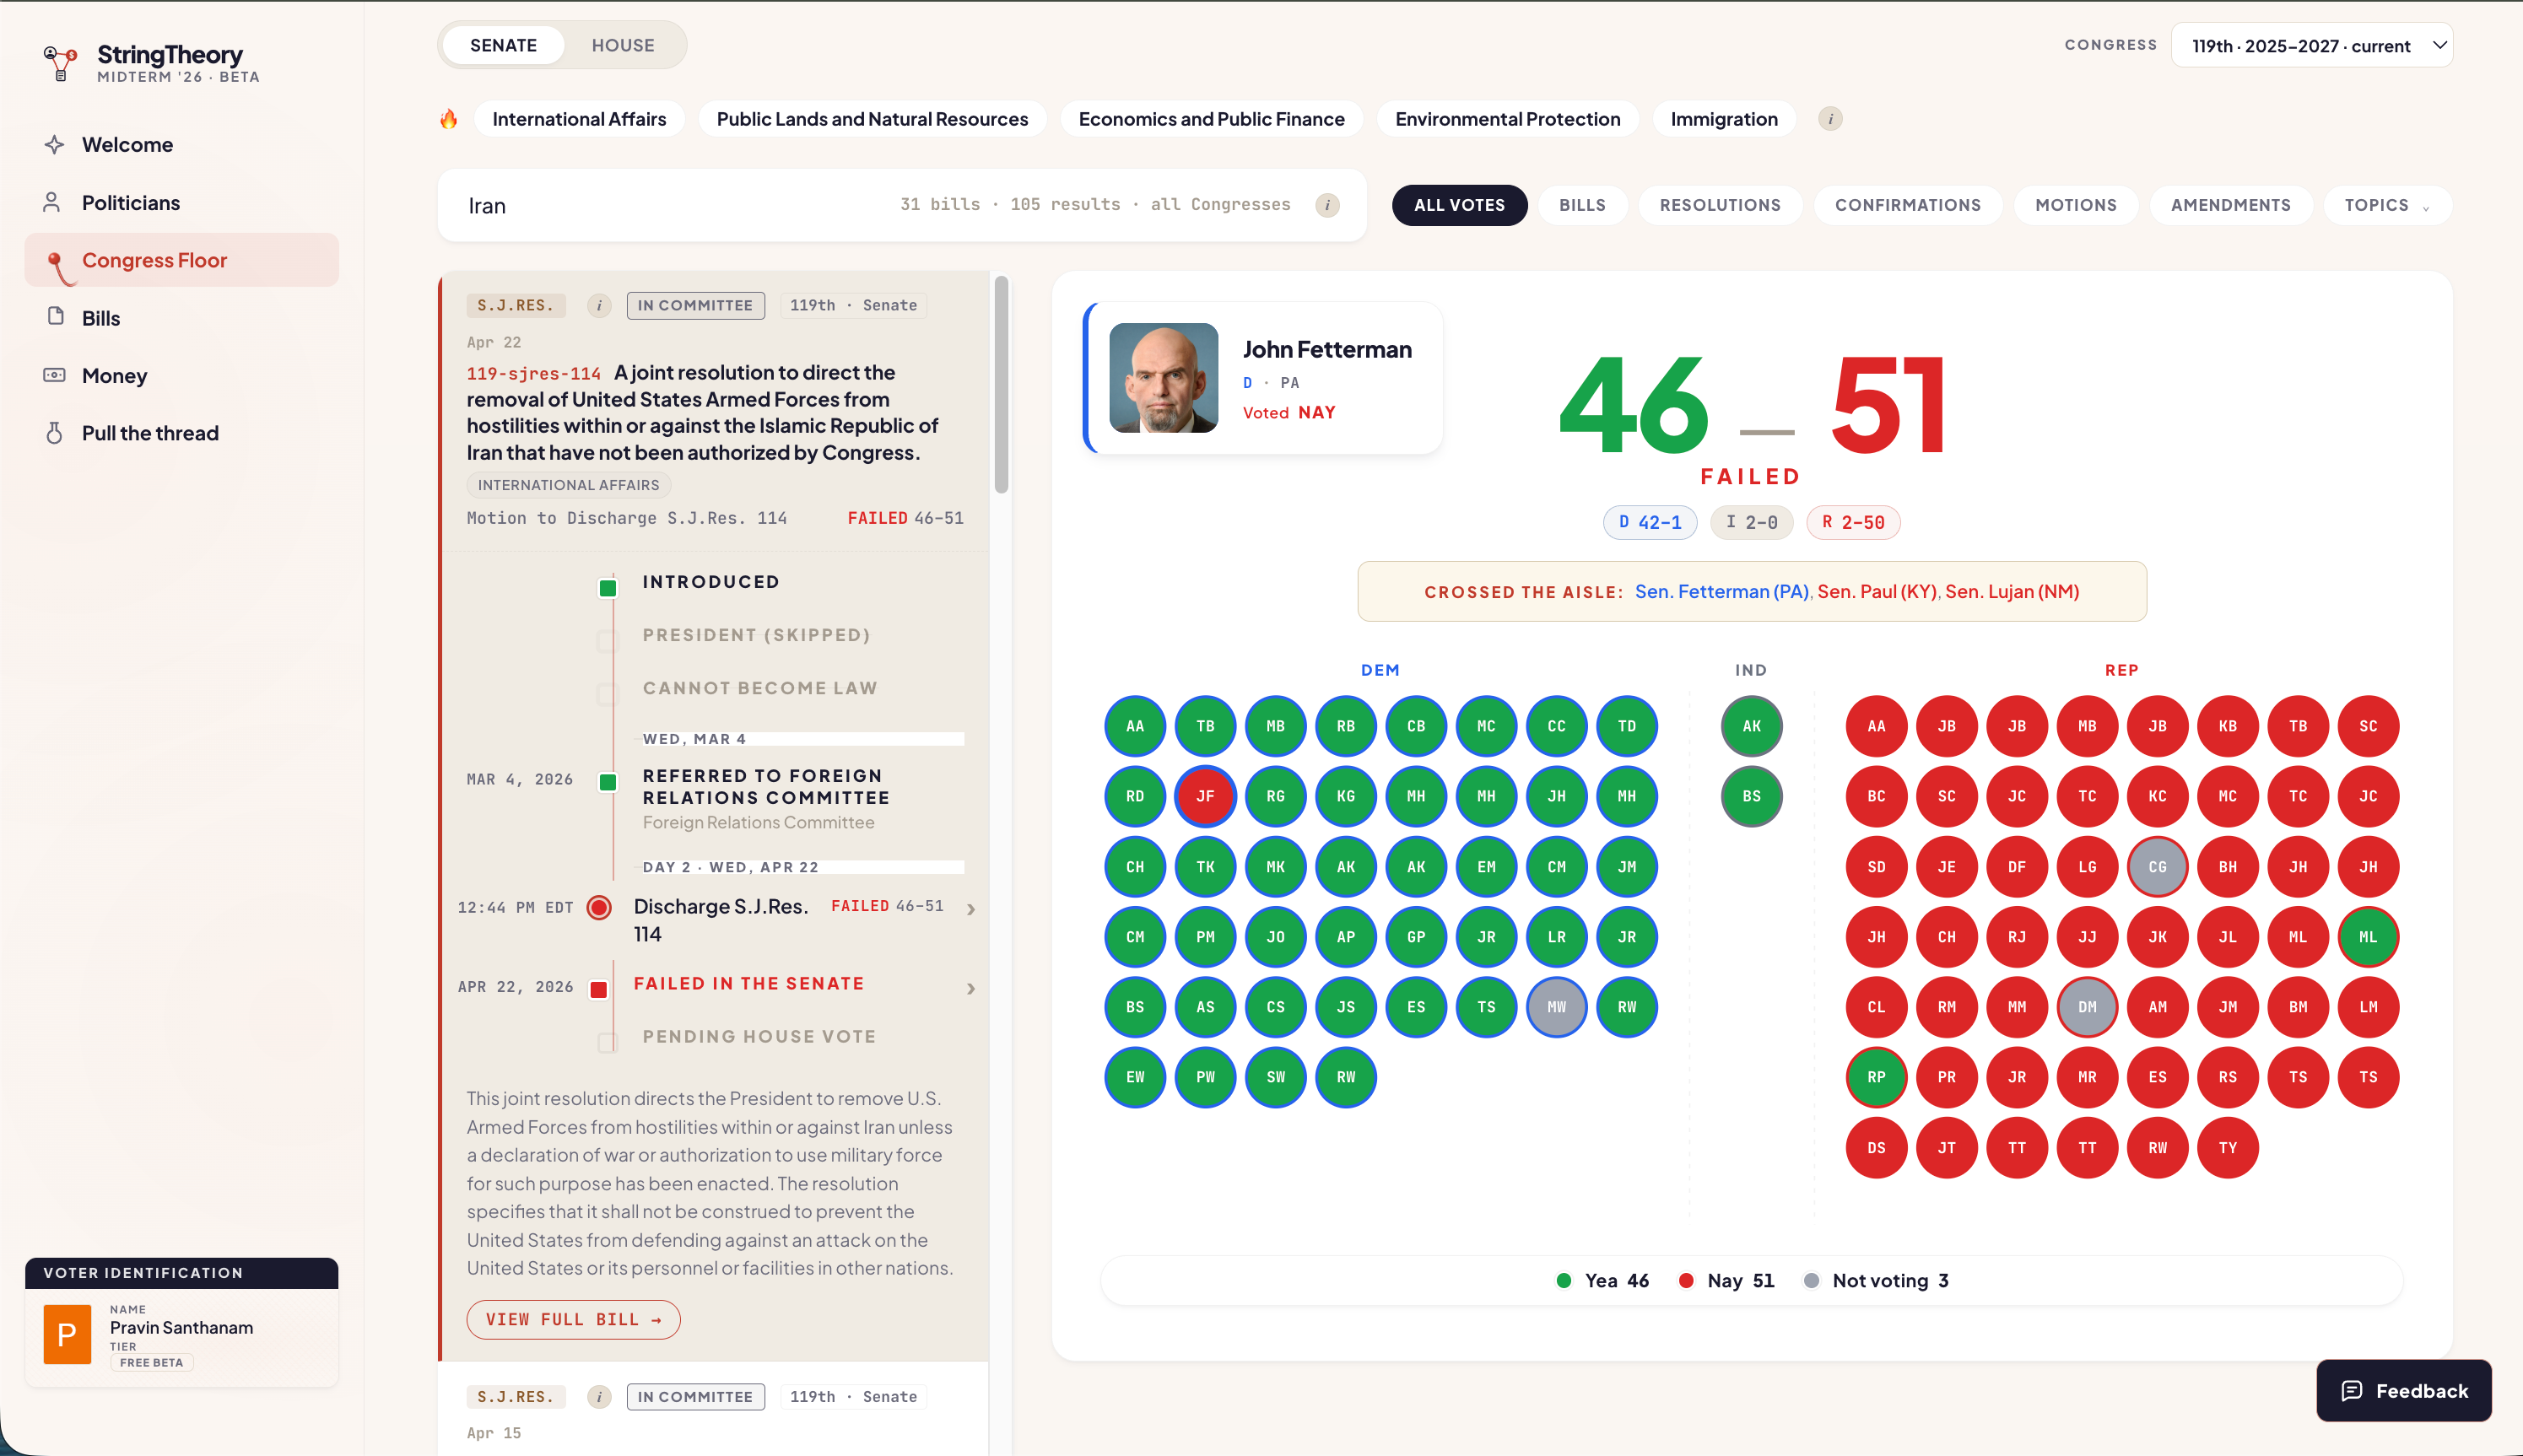
Instantly, the partisan divides become visually obvious. You can filter the floor by specific topics—like “International Affairs,” “Defense,” or “Economics”—and also search on the title and content of your target legislation. Oftentimes, the same piece of legislation will have multiple votes as it passes through each chamber, and we visually showcase this through timelines on both the Congress Floor and the individual Bills page.
3. Bills
Instead of relying on editorialized summaries from the news, StringTheory allows you to search and track bills directly through the system.
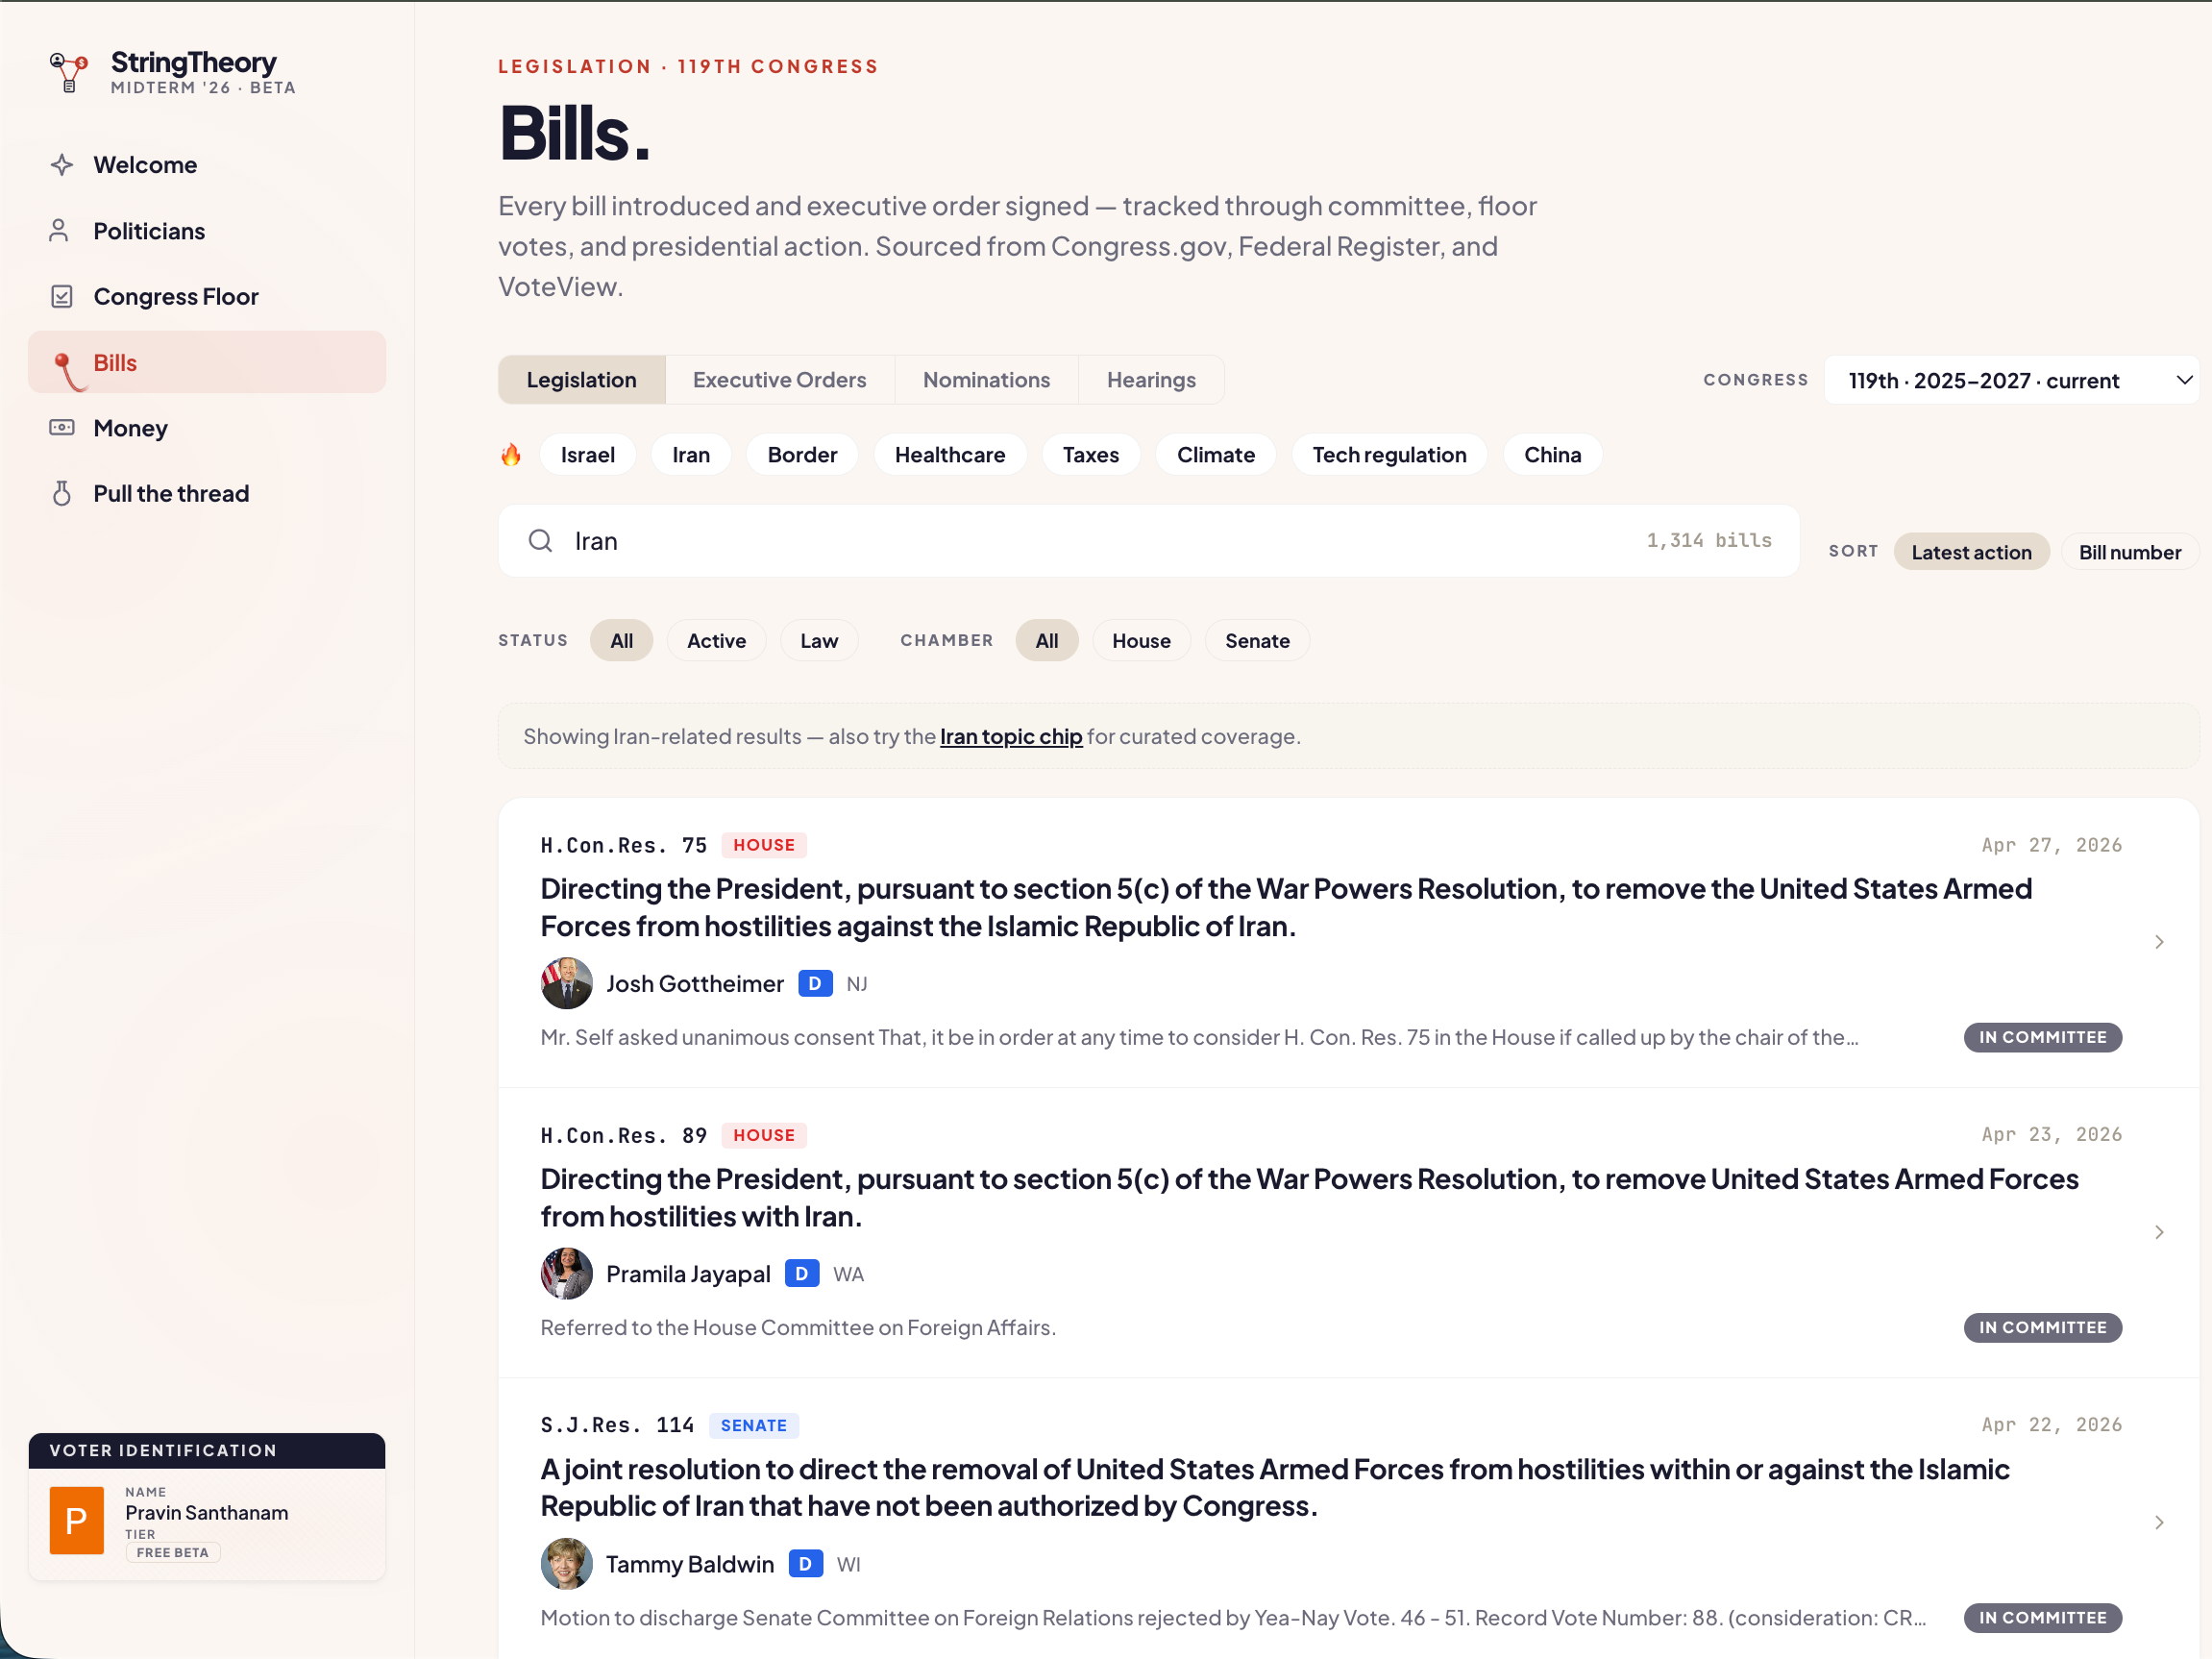
When you click into a specific piece of legislation, it acts as a central hub. You can see its entire lifecycle timeline. You instantly see the primary sponsors, co-sponsors, and the tagged topic areas for that bill.
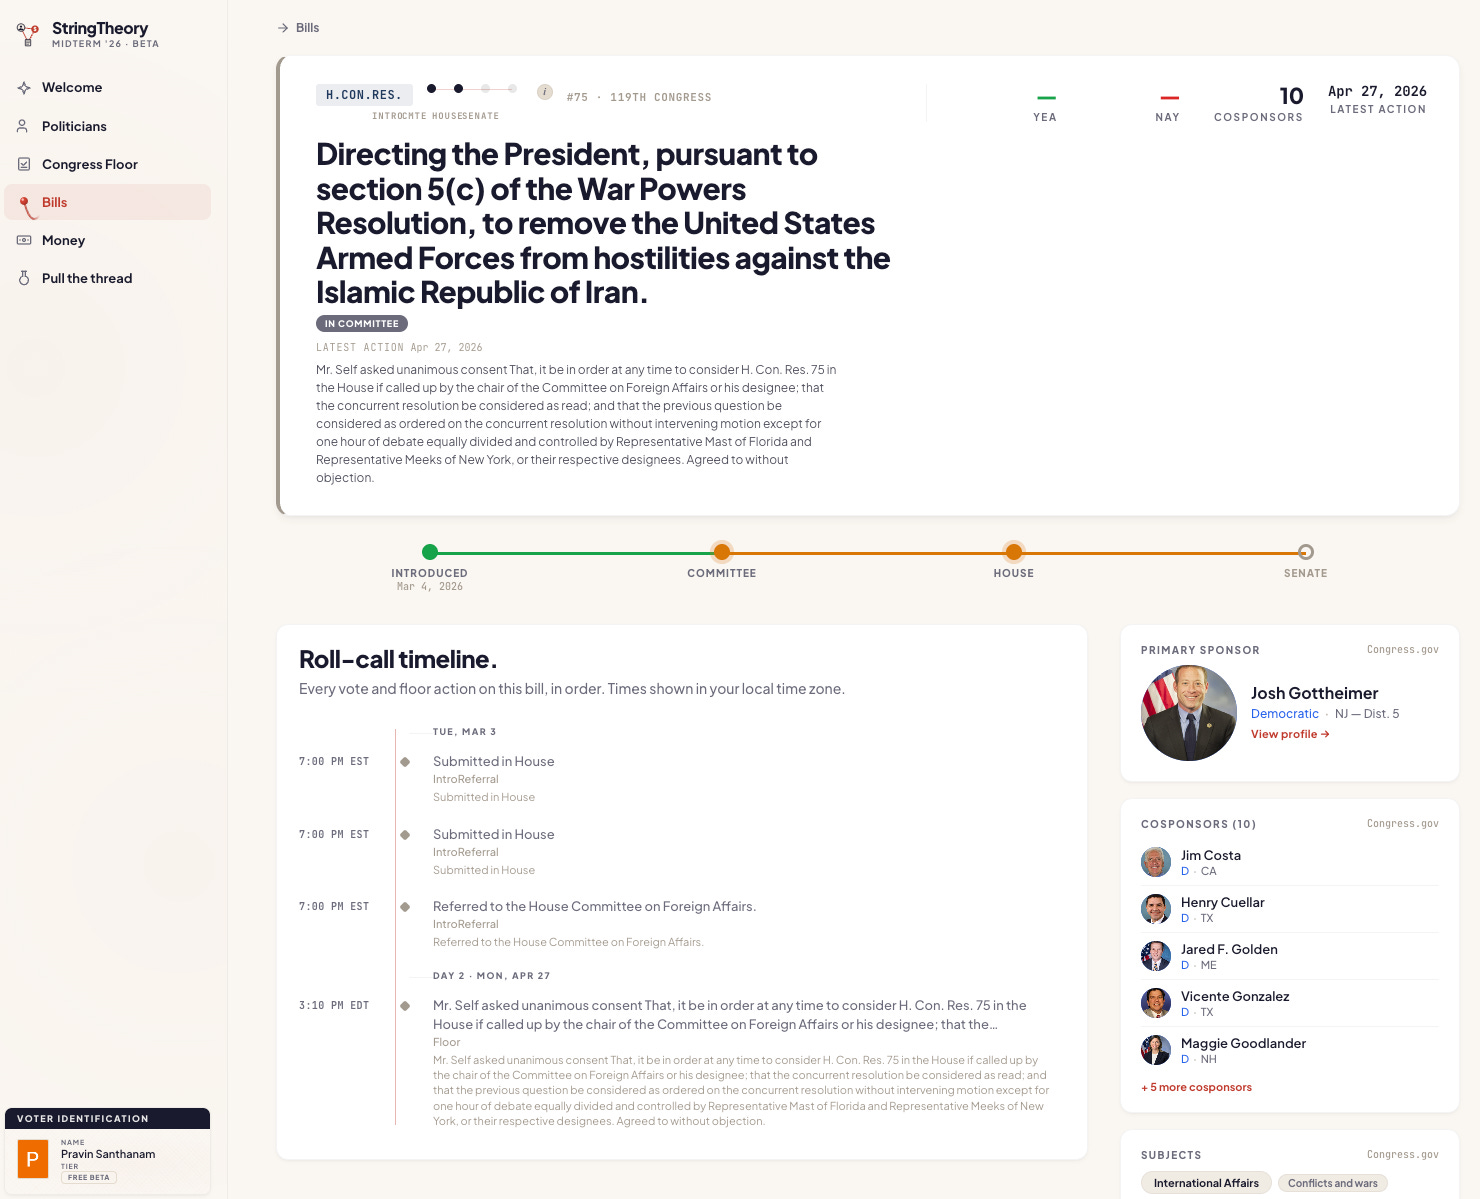
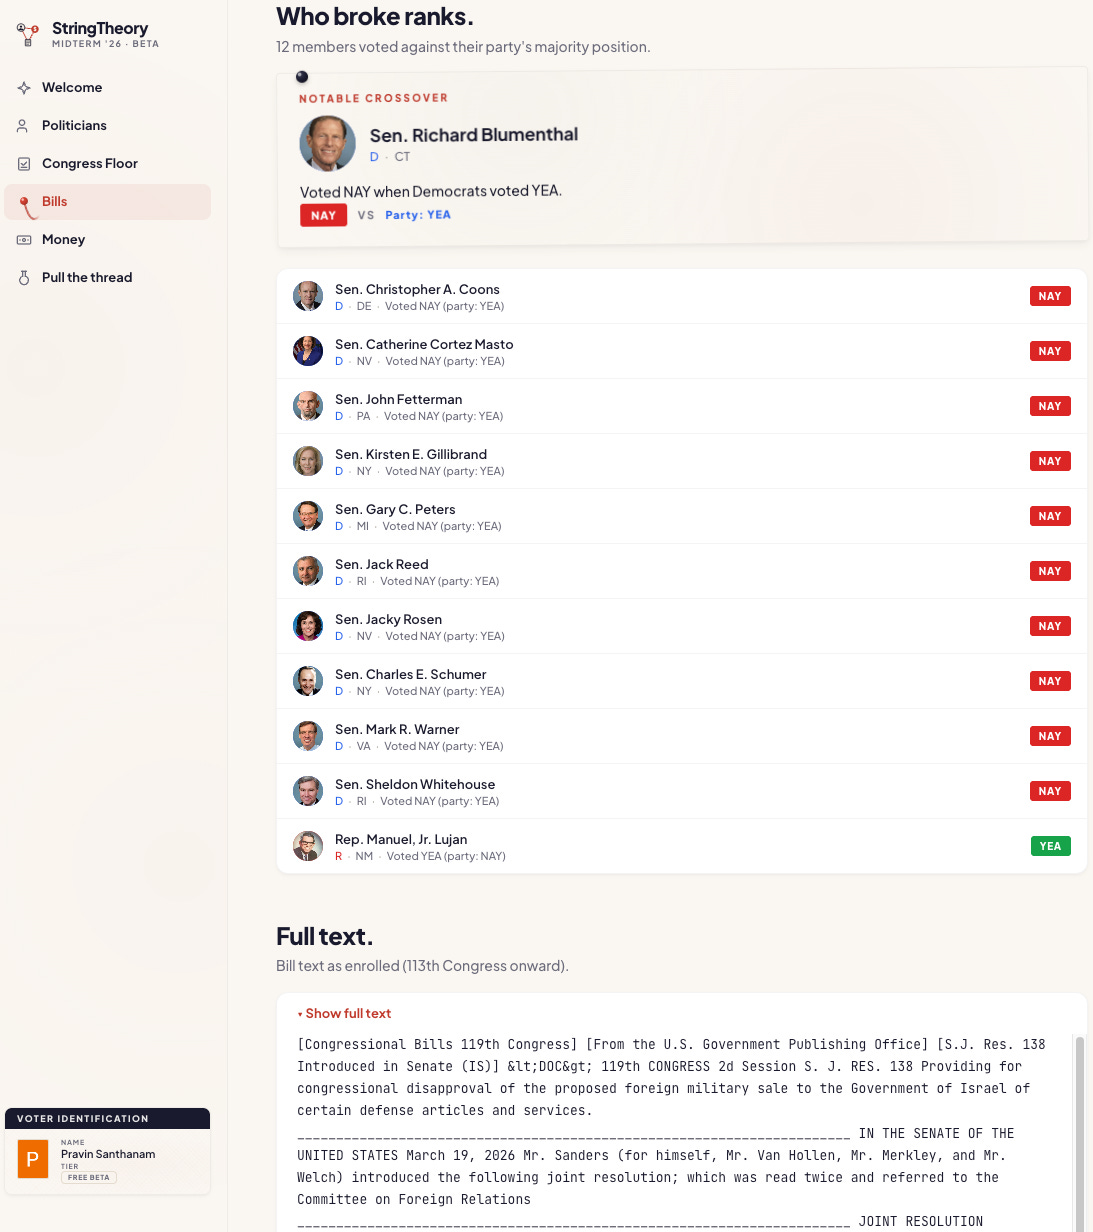
Scroll down, and the graph isolates exactly who voted against their party’s majority. And you can read the full text of the bill itself without ever leaving the page. On the roadmap is building advanced Natural Language Processing (NLP) metadata enrichments, so we can pull out more nuanced concepts, topics, keywords from the full raw bill text, versus someone’s opinion on passed legislation.
4. The Executive Branch
The legislative machine doesn’t stop at Congress, and StringTheory also tracks Executive Branch officials, namely the President and Vice President.
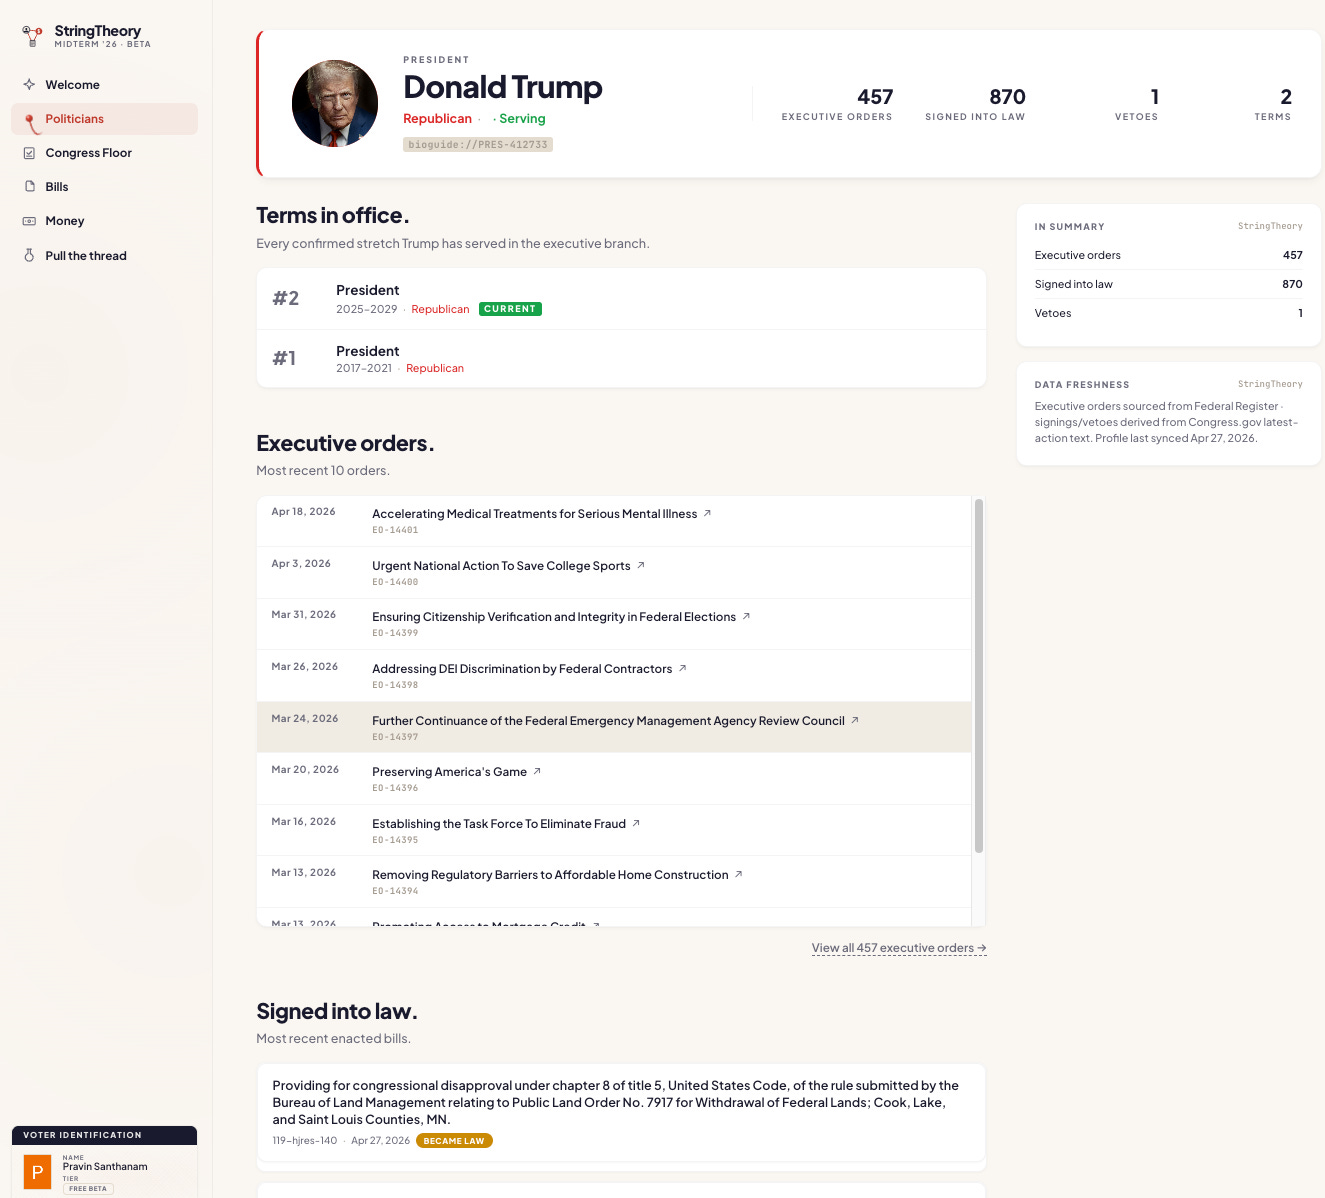
You can track Executive Orders and bills signed into law, allowing you to see how unilateral actions fit into the broader political landscape. You can also see on VP pages when the VP has voted as a tie-breaker in the Senate.
But the Executive and Legislative branches collide most visibly during the nominations process.
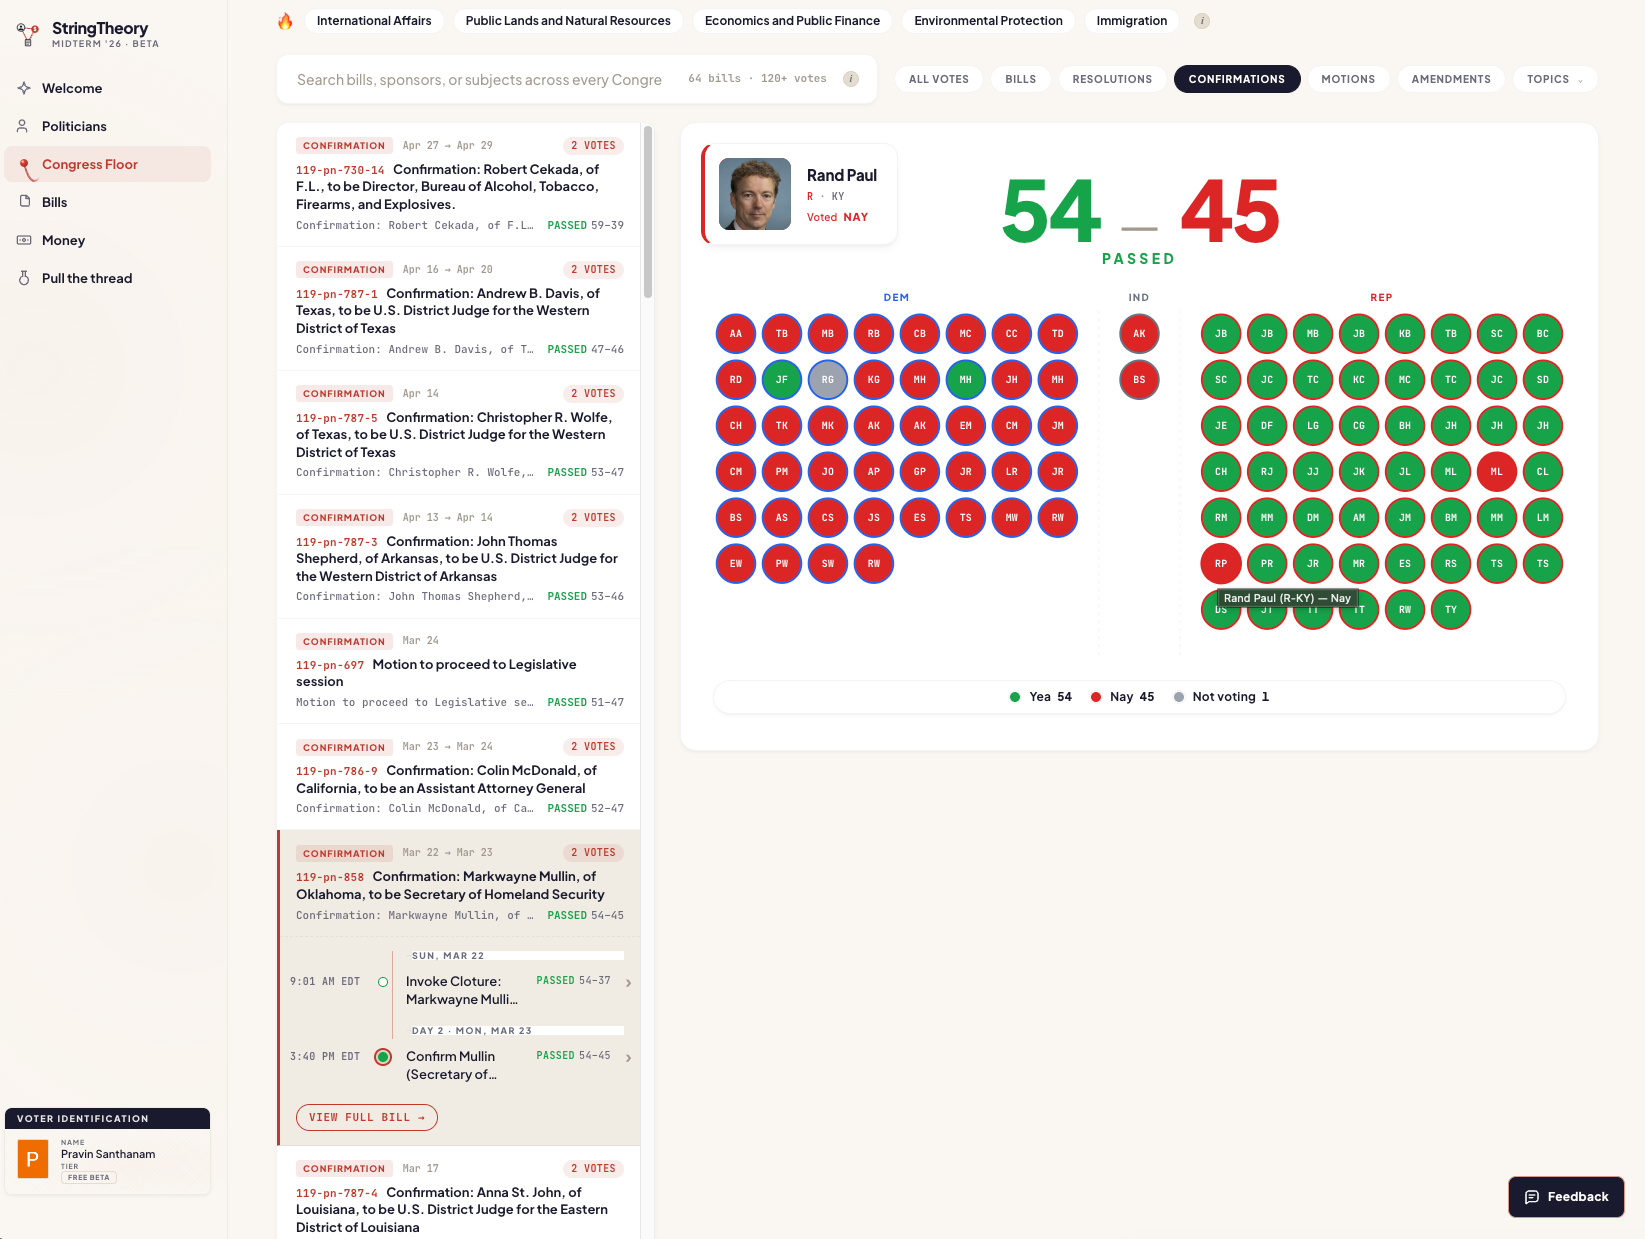
StringTheory maps these confirmation battles directly on the Congress Floor view. When the administration appoints a new cabinet secretary or federal judge, you can watch exactly how the chamber whipped the votes, revealing which politicians align with the White House.
What’s Next & The Beta Launch
We will be rapidly adding more complex features and analytics to this graph (campaign finance data is highest priority), but this legislative foundation is the necessary first step.
I’m dropping the beta link right here on Substack this weekend for anyone to sign up and try it out. You will be able to search for your own representatives, track the bills you care about, and pull the threads yourself.
See you this weekend.
— Pravin
Pretty cool. Looking forward to trying it out.