
Last month, Congress was negotiating college athletes’ pay, the sale of TV rights, and how much more you could be charged for tickets. All in the same bill.
The Protect College Sports Act passed the Senate 77–22 on September 28. It would set rules for athlete pay and transfers and let schools and conferences sell certain TV rights together.
A proposal to cap annual ticket-price increases at 4% lost, 42–54. The bill passed; the ticket cap didn’t.
Which clauses protect athletes, and which protect schools and conferences? Who backed the bill but opposed the ticket cap? Who funds those lawmakers? And how likely is the bill to become law?
That’s the idea behind StringTheory: follow a question from a clause, to a vote, to a lawmaker and their funding. Last week, I dropped the Ask walkthrough. Today, I’m introducing the machine learning (ML) series on the models I’m building to connect those pieces. We are going to briefly touch on the type of models we are able to build using StringTheory’s knowledge graph with examples on how they are useful.
Starting Friday, each article in the ML series will follow one model through a real story, including where it gets things wrong. We’ll get into how I train it, prepare the data and test the results, and whether it helps us find something worth investigating.
A lot of these models are already integrated throughout the app now. Below, I point to those screens and explain what happens behind the scenes. Figures are an October 27 snapshot unless otherwise dated; the donor examples were refreshed October 28. Shared records open without an account; create a free account to explore further.
Reading the text (NLP)
These models read the words in context: what a bill says, what an amendment changes and what a reader is asking. That work is called natural language processing, or NLP. I’m adapting text models such as ModernBERT to these political records.
Bill Section Tagger
This model tags each passage in a bill with its purpose: defining a term, banning an action, setting a limit or requiring a report. It also looks for exceptions and possible riders: provisions that seem out of place with the bill’s main purpose. Open Statutory Text on a bill to see the labels beside its clauses.
Example: the Protect College Sports Act uses more than $50,000 in lifetime giving as one way to decide who counts as an “associated entity,” a person or group connected to a school. That definition feeds into rules on payments to athletes. A number in the definitions section can determine who comes under rules much later in the bill.
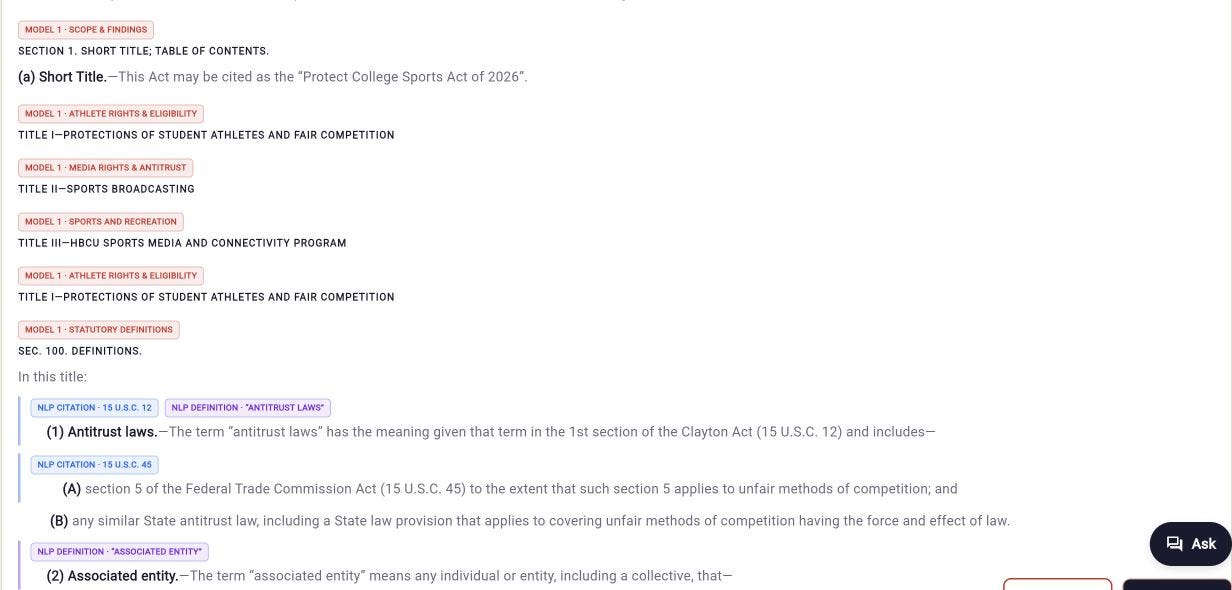
Tags for the Protect College Sports Act’s actual clauses, including definitions and references.
Amendment Intent
This model reads what an amendment adds, removes or limits in a bill. Those changes can win or lose support. The app’s amendment ledger shows intent labels alongside the proposal and recorded vote.
Example: John Kennedy’s ticket-price amendment would cap annual college-sports ticket increases at 4%. Kennedy argued for fans’ affordability. Ted Cruz opposed the cap, arguing it would cut revenue available to athletes. Both supported the underlying sports bill.
Retrospective vote estimate (October 27): using only information known before the September 28 vote, the model gives the amendment 5.7% adoption odds. This was calculated after the vote, whose recorded result was 42–54, short of the 60 required. The intent model reads what changes; the vote model estimates whether it can pass.
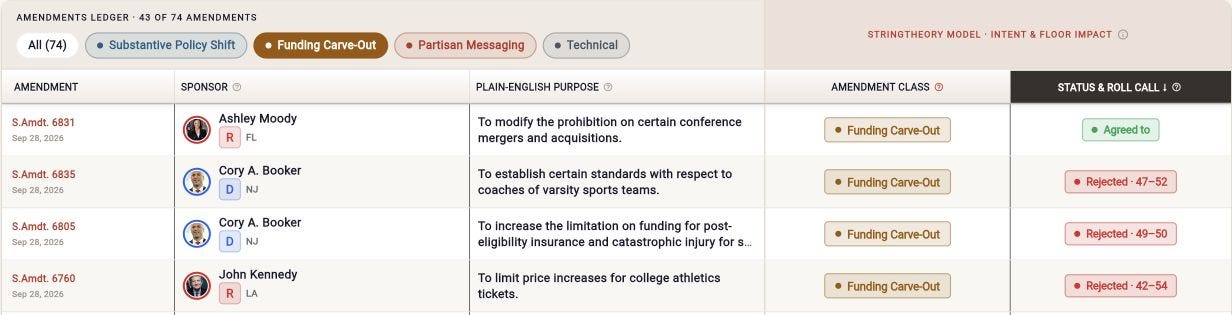
Kennedy’s ticket cap in the amendment ledger, showing the recorded September 28 vote.
Poison Pill Detection
Poison Pill Risk is another output of the amendment intention model. It flags changes that could gut the bill or cost it support. The app shows a risk badge when an amendment is flagged.
Example: Rand Paul’s amendment 6758 proposed replacing the entire sports bill with an antitrust exemption for college conferences and associations: legal protection from certain competition laws. The original package’s athlete protections and other rules would disappear. Recorded result: 1–94 against. Retrospective adoption estimate (October 27): 0.5%. The adoption odds are separate from the poison-pill concern: what the replacement would do to the bill’s underlying deal.
A replacement can also be a negotiated deal, so the flag starts an investigation; it doesn’t establish the sponsor’s motive.
Ask Router
Before Ask writes an answer, this model works behind the scenes to choose which records to look up. A question about votes needs a different research path from a question about campaign money.
Example: “Which House Democrats voted for the GENIUS Act?” starts with the final-passage roll call. Follow it with “Who funded them?” and the research needs to switch to finance records while keeping the same lawmakers in view.
Claim Verifier
Claim Verifier works behind the scenes in Ask after an answer has been drafted. It compares each factual sentence with the cited records and your original question, then flags mismatched people, numbers, dates or votes.
Example: if Ask drafts “102 Democrats voted for the GENIUS Act rule on July 15, 2025,” the verifier should flag the mismatch. No Democrat backed that rule; 102 voted for the bill’s July 17 final passage.
Ask records the model’s flags for review. Separate checks on numbers, dates and sources control which claims can appear in the answer you see.
Following the connections (graph models)
I’m adapting KumoRFM-2, an open source graph foundation model that learns from connected records, to learn the patterns in StringTheory’s knowledge graph. A prediction can draw on a lawmaker’s party, committee role, financing and voting history together to learn patterns.
Vote Prediction + Defection Watch
Vote Prediction estimates who will vote Yea or Nay, and whether there are enough votes to pass. On a bill, The Whip Line shows projected tallies and Floor Passage Odds. Defection Watch highlights members most likely to oppose their party’s majority.
Forecast (October 27): for a possible House vote on the Senate-passed Protect College Sports Act, the model gives 83.4% passage odds and expects about 232 Yeas.
For this possible House vote, the model expects 11.4% of voting House Democrats to oppose their party’s projected majority position. For Don Davis, it gives a 97.2% chance of doing so: +85.8 percentage points above that comparison. The +/- measures the gap from the party projection; what you make of that gap depends on your question.
The chart adds Brian Fitzpatrick (R–PA) for comparison.
Bill Survival
Getting a bill through one vote is only part of the story. In the app, Survival Odds follows its chances through committee, the House and Senate, and being signed into law. It also tracks provisions that pass inside another bill.
Forecast (October 27): the Protect College Sports Act has already passed the Senate. The app gives it 83.4% House passage odds, against a 55% comparison rate for bills that have passed the Senate: +28.4 percentage points.
Its 76.7% chance of becoming law is compared with 48% for Senate-passed bills: +28.7 points. The comparison updates as the bill advances, so we judge its next step against bills that have reached the same stage.
TikTok shows why that matters: the House passed a standalone divestiture bill in March 2024, then revised provisions became law in a larger package in April. Following only the original bill number would miss how the policy passed.
October 27 projections. Both next-step comparisons use bills that have already passed the Senate.
Politician Finance Signals
Start with Ted Cruz in the sports-bill story. Introducing the bill is a sponsorship; voting on it is a separate action. The finance models try to tease out how much voting and sponsorship activity is affected by campaign donations.
Donor Votes (+/-): the voting comparison
Find the funding links. Match the lawmaker’s donor industries to the issues in each vote. Count only money received before the vote.
Calculate expected alignment. The model estimates alignment from party, House or Senate, ideology, party loyalty, bipartisan activity and committee responsibilities. Campaign-finance inputs are left out of that estimate.
Compare with the voting record. Did the member vote with those industries more or less than expected? The score measures the gap between the record and that expectation, with closer votes carrying more weight.
Example, October 28, 2026: Susan Collins shows +2.6 Donor Votes across 57 scored roll calls. Her recorded alignment with funding industries is 77.2%, against 68.7% expected by the no-finance model. The percentages describe alignment; +2.6 is the adjusted, weighted vote score, not a percentage-point difference.
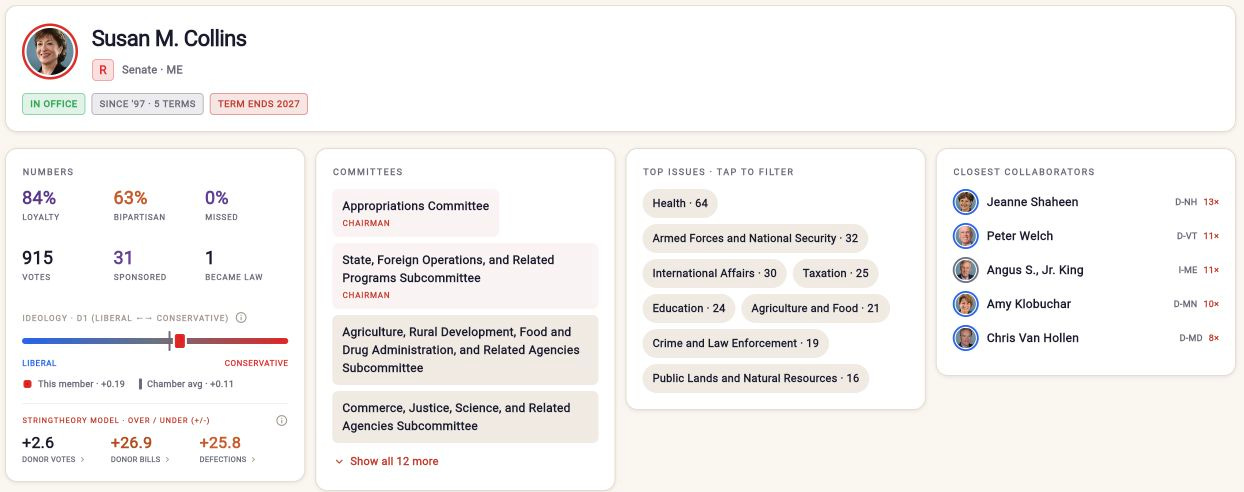
October 28: Collins’s +2.6 is an adjusted vote score. The alignment percentages in the example explain the comparison behind it.
Donor Bills (+/-): the sponsorship comparison
Look at the legislative work. Match the bills and amendments a member puts forward to the industries funding them, then read what the provisions actually do.
Calculate expected work. Use comparable members’ party, chamber, committee responsibilities and legislative activity to establish a comparison for work in those issue areas.
Compare with the sponsorship record. Does the member’s industry-linked legislative work run above or below that expectation? Positive means more than expected; negative means less.
Example, October 28: Marsha Blackburn’s Donor Bills score is −44.5, below its comparison. Her Donor Votes score is “—”: there aren’t enough votes within her funded industries where the industry’s position is established. One comparison has enough evidence; the other doesn’t. A dash is not zero.
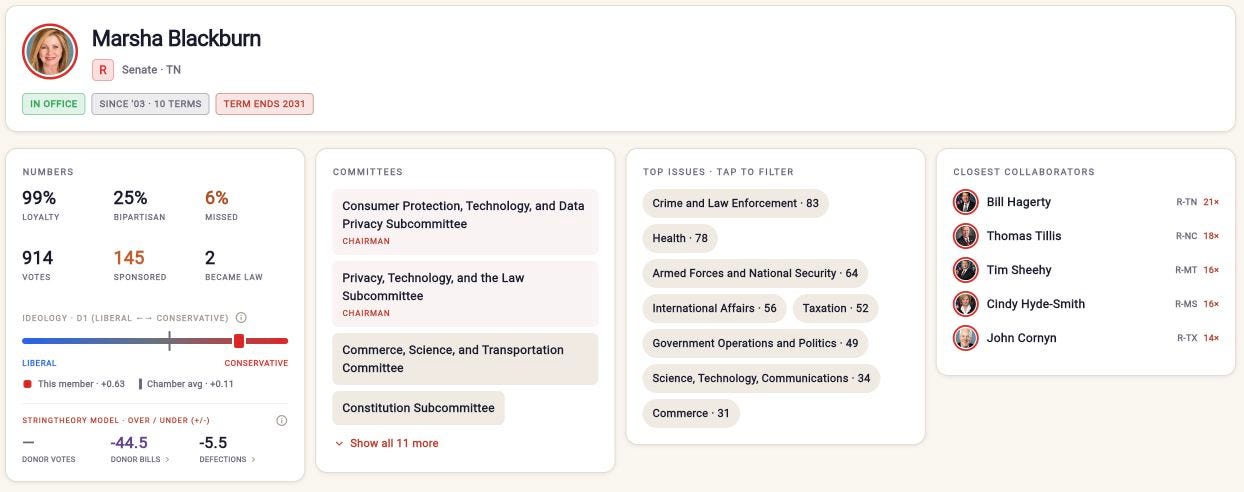
October 28: a scored Donor Bills comparison beside an unscored Donor Votes field. Missing evidence stays visible.
Topic Vote Alignment (+/- pp): the prediction comparison
Predict without donor data. Estimate voting alignment in a policy area using the member’s political record, leaving campaign-finance inputs out.
Add donor data. Estimate that same alignment with industry funding included.
Compare the predictions. The gap, in percentage points, shows how much donor information changes the model’s estimate. This compares two predictions, rather than a prediction with the recorded vote.
Example, October 28: for Ted Cruz’s Commerce comparison, the model estimates 85.0% alignment with donor data and 50.1% without it: +34.9 percentage points. That is what the Funding page calls Topic Vote Alignment. It is not a measure of how much of his funding comes from Commerce, or which issues dominate his agenda.
Finding the right records and questions
The next models help turn all of that information into a useful investigation: find the right person, find the right record and choose the next question.
Entity Linker
Entity Linker works behind the scenes to keep each person’s record separate. It compares names with state, office, career dates and other identifiers before connecting votes or donations to a profile. If the evidence is thin, it can leave the match unresolved.
Example: Mike Rogers of Alabama and Mike Rogers of Michigan share a name and party. They have different careers and identifiers. Merge them, and someone else’s votes or funding can end up on a profile.
Another example is in FEC campaign financing filings, often times the same people will come up under different names and risk undercounting donations because all of their entities are not merged under one identifier.
Hybrid Search
Try this in the app’s search bar: you can look for a record without knowing its official name. Hybrid Search combines matching words, similar meanings and the connections between bills, votes and people.
Example: searching “TikTok” should find the relevant record even when the title says Protecting Americans from Foreign Adversary Controlled Applications Act or National Security Act, 2024. You shouldn’t need a bill number before you can start investigating.
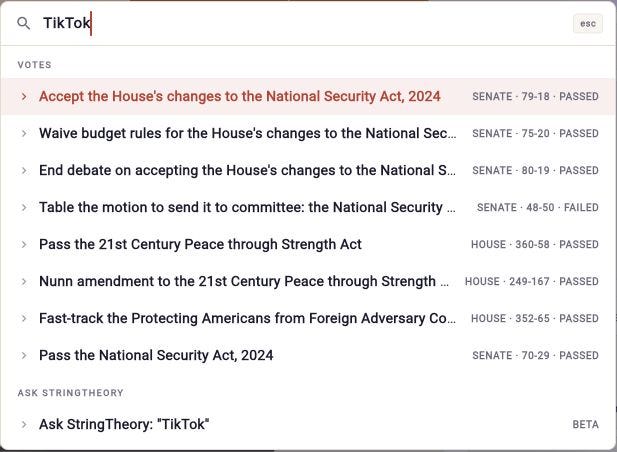
Searching “TikTok” finds formal legislative titles and related roll calls.
First up, Friday
On Friday, October 30, we’ll start with Vote Prediction and Defection Watch: what the model knew before a vote, how it compares with simply predicting the party line, and where it misses. We will go through every model and new ones that come out, as well as re-visit models that have improved, and how it allows us to understand the system better.
That’s what ties this series together. If there’s a model you want me to unpack next, let me know in the comments.
See you Friday.
— Pravin
Explore StringTheory: Web app · Android app