
Last week, I ended the Funding walkthrough by admitting that the experience could still feel like a lot.
At the same time, I was building StringTheory’s own proprietary models to forecast votes, identify unexpected defections, and examine patterns between campaign money and legislative activity. I wanted those models to be central to the product.
That forced me to rethink the interface. I’d been organizing a lot of information into profiles, tabs, charts, and filings, then leaving people to work out where to start. The models made the next question harder to avoid: what should the app help you notice?
I want StringTheory to give you a useful first comparison: what stands out, relative to what, and what is worth looking at next. That’s the shift behind this refactor. Here’s the direction:
What I borrowed from baseball
One reference point for this redesign was my time in the Kansas City Royals’ front office. I spent roughly the first four years of my career as an analyst in the R&D department, building models, tools, and reports for baseball operations. A key idea was figuring out how much credit a player deserved for a result.
A model trained on league-wide data learns what tends to happen in comparable situations: a shot from this spot on the floor, or hard contact on this type of pitch. Compare the actual outcome with that expectation, and you can start assigning credit. Do better than expected, and you earn positive credit. Do worse, and it goes the other way.
One good result can be luck. Keep outperforming expectations, though, and you’re probably pretty good at that thing. The next step is checking how quickly the metric stabilizes as the sample grows, and whether it predicts future performance. That’s how you start separating repeatable skill—or a real weakness—from a hot or cold streak.
Statcast is a great example. Its expected-statistics leaderboard puts the recorded result, expected result, and signed difference beside each other. That’s the comparison I wanted to make easier in StringTheory, so you can see what stands out before deciding where to dig.
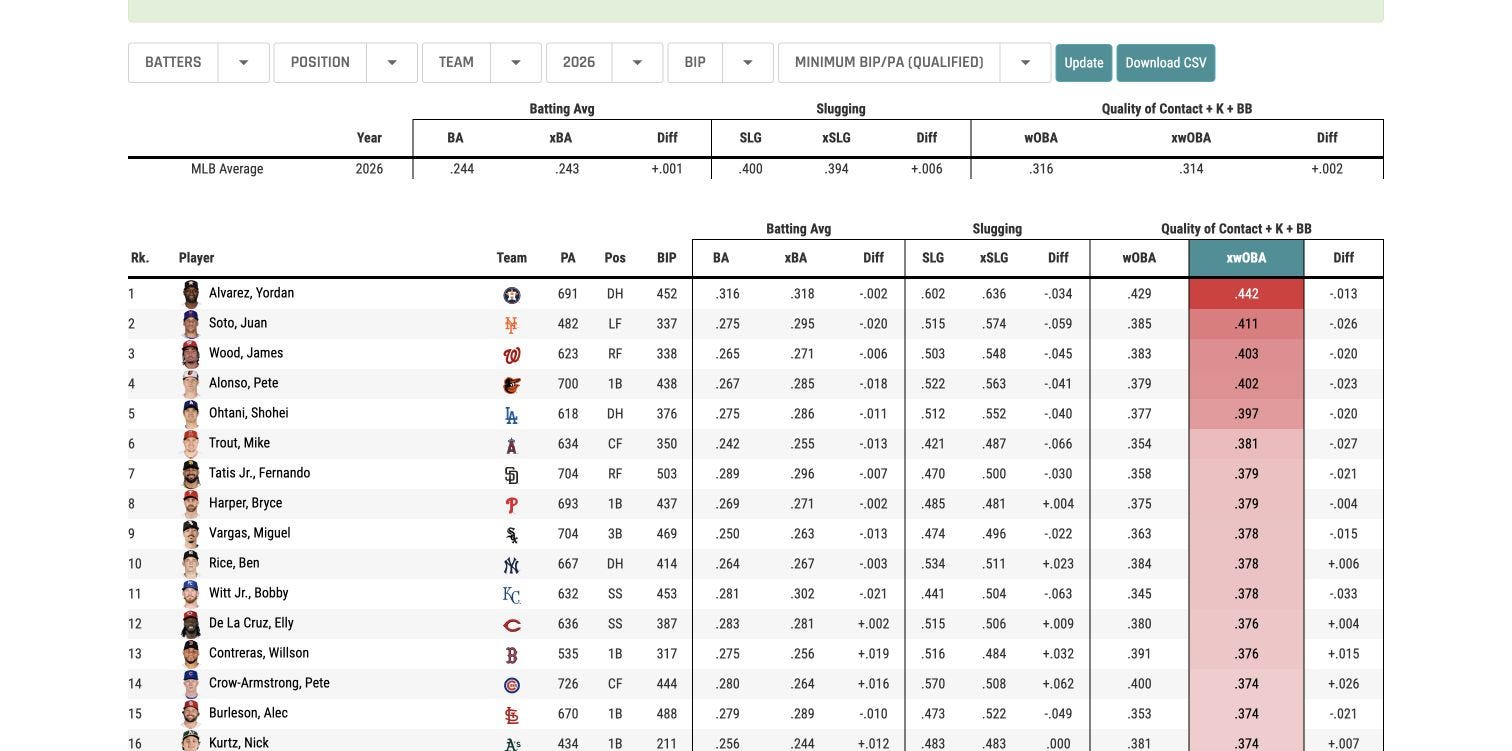
Baseball Savant, 2026 leaderboard, captured October 27. The “Diff” columns show recorded minus expected values, with positive and negative differences. Tap to enlarge.
Nate Silver’s SB Scores apply a related idea to elections. In his Arizona example, Ruben Gallego won his 2024 Senate race by 2.4 points, while Kamala Harris lost the presidential race there by 5.5. The difference gives Gallego an SB Score of +7.9 points.
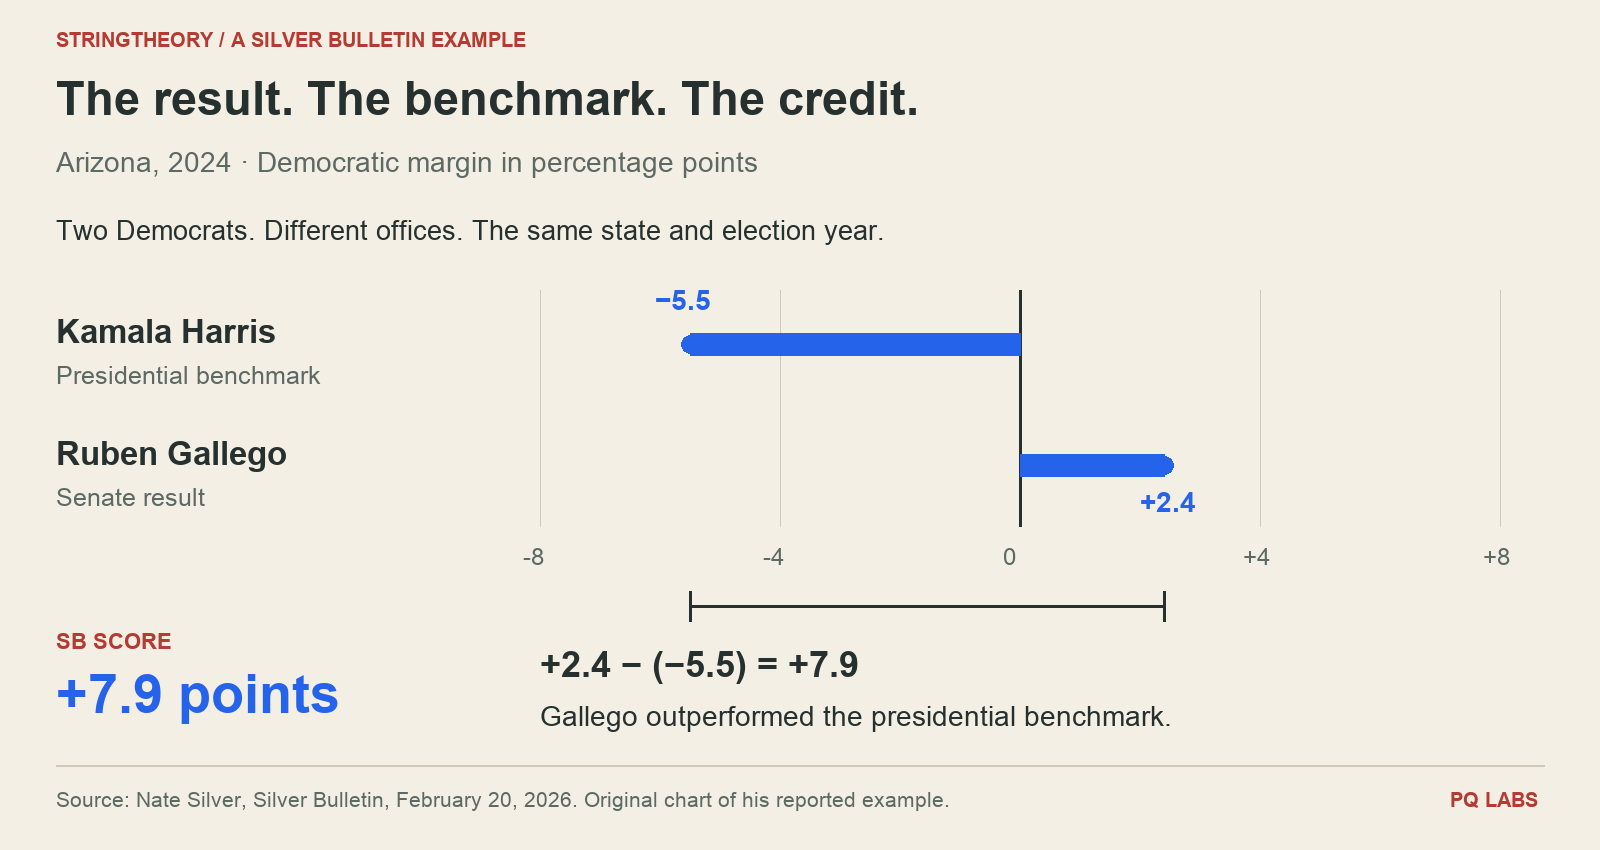
Same-year election results provide the benchmark. Original chart of Silver’s reported example; this is a comparison of margins, not a pre-election forecast.
That’s the credit idea in political terms: the win tells you he finished ahead; the +7.9 tells you how far he outperformed the presidential benchmark in the same state and year. How much of that outperformance holds up across elections is the next question.
The same vote can tell two different stories
On the Senate’s July 1, 2025 passage vote for the One Big Beautiful Bill Act, Susan Collins and Elizabeth Warren both voted No. Collins was one of three Republicans opposing it; all 45 Democrats voted No. The official roll call is the same starting record, but the party context changes what each vote tells you.
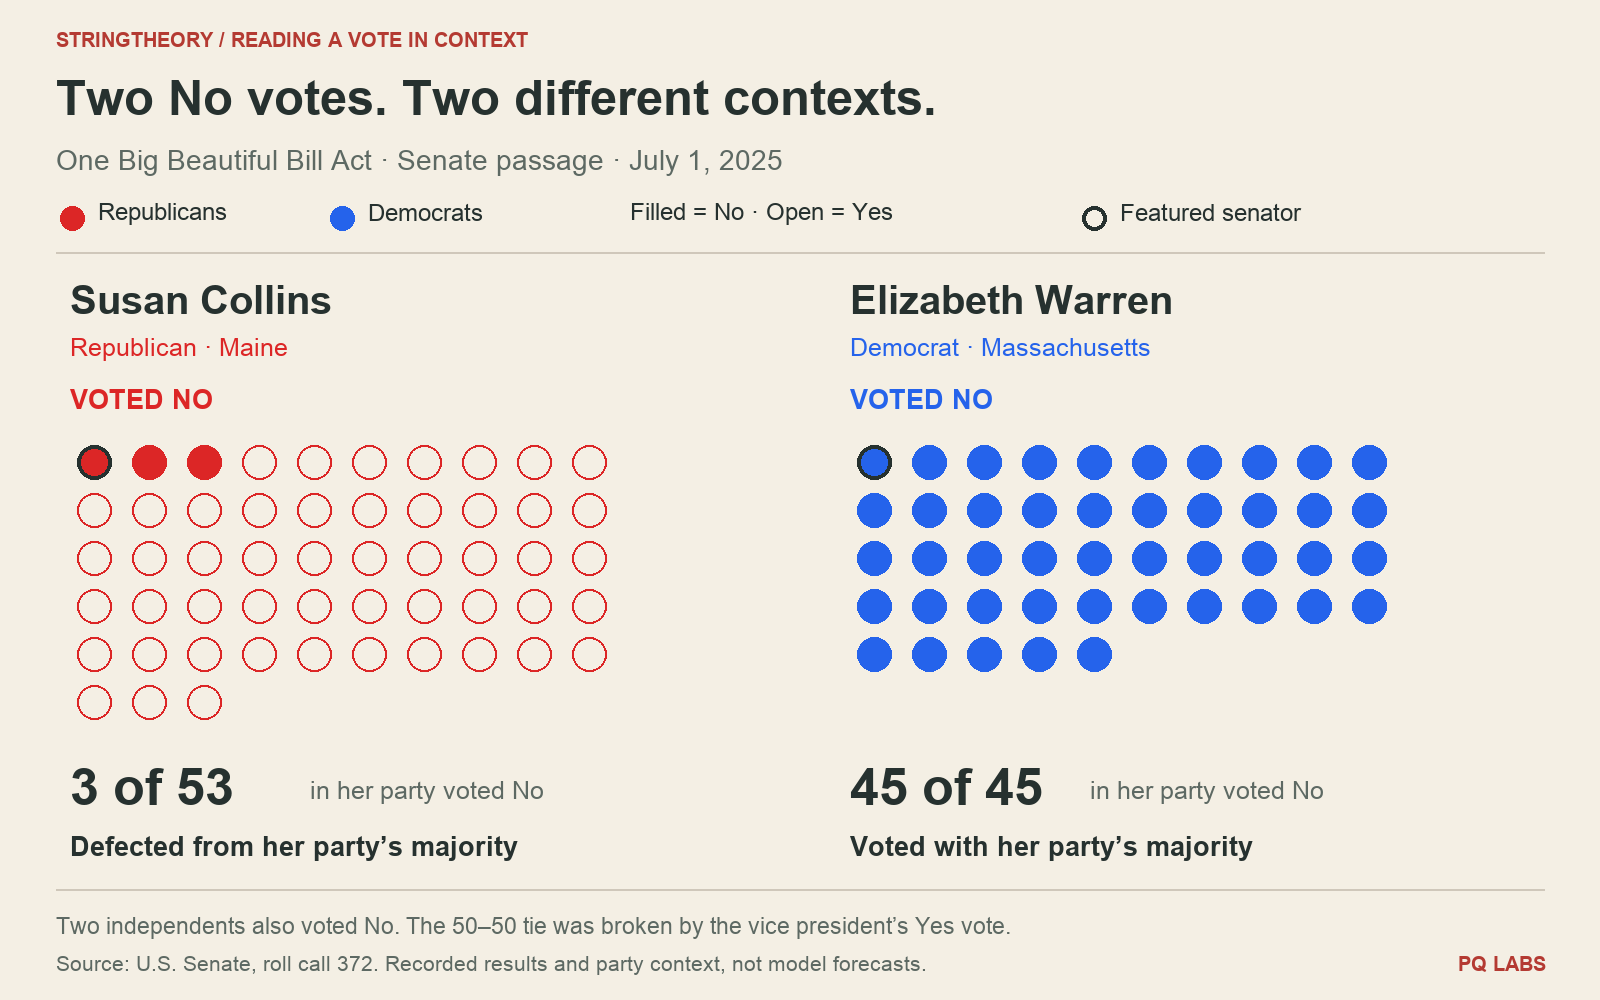
Each dot is a senator; dark rings mark Collins and Warren. Filled dots voted No; open dots voted Yes. Recorded votes and party context, not model predictions.
That’s why I’m leaning into +/-: the recorded outcome minus an expected baseline. For Defections (+/-), positive means more than expected, negative means fewer, and zero means in line with the expectation. The models can bring in context beyond party, and each measure needs its own baseline.
Across many votes, that helps you find patterns a raw count can hide. Take these illustrative numbers for one lawmaker over the same period:
Defections (+/-): 15 defections against 10 expected gives +5. Someone looking for party independence might welcome that; someone trying to keep a caucus together might see a problem.
Donor Votes (+/-): 30 votes aligned with top donor industries against 20 expected gives +10. That flags a relationship to investigate; it doesn’t establish that donations caused those votes, but this person is voting with top donor industries more then someone with their donation patterns would expect.
Donor Bills (+/-): Four sponsored bills in top donors’ issue areas against seven expected gives −3. That’s less donor-sector sponsorship than expected, without proving that the lawmaker is free of donor influence.
The sign tells you the direction, and the size tells you the gap. Zero means the record matched the expectation. What you make of that difference depends on the behavior and the question.
What that changes in the app
Start with a question. A state delegation, a preset investigation, and the guided walkthrough give you somewhere useful to begin. You shouldn’t need to learn the app’s structure before asking where the defections are or which bills might move.
Use one comparison language. Sortable tables put lawmakers and measures together. Defections (+/-), Donor Votes (+/-), and Donor Bills (+/-) use the same pattern: Actual, Model Expected, and Net Impact (+/-), with explanations you can open on a phone or desktop.
Group the decisions that belong together. The bill view brings its brief, Survival Odds, and Roll Calls together, with Amendments and Statutory Text in a second view. I’m taking the same approach to the campaign finance view refactor: flatter views for comparing lawmakers, races, and funders, with less navigation between them.
Those patterns should give you a useful next question. Take it into Ask to investigate the votes, bills, and funding ties behind it. The Ask walkthrough shows how that research flow works and how to check the evidence behind an answer.
I’ll start getting into how I’m building and testing these models on Friday, beginning with Vote Prediction and Defection Watch.
Try StringTheory and tell me where you get stuck. Sign up free or check out the interactive tour on the welcome screen.
See you Friday.
— Pravin
Explore StringTheory: Web app · Android app